. 2016 Feb 1;11(2):e0148411.
doi: 10.1371/journal.pone.0148411. eCollection 2016.

Automated Protein Localization of Blood Brain Barrier Vasculature in Brightfield IHC Images

Affiliations

Automated Protein Localization of Blood Brain Barrier Vasculature in Brightfield IHC Images

Rajath E Soans et al. PLoS One. .

Abstract

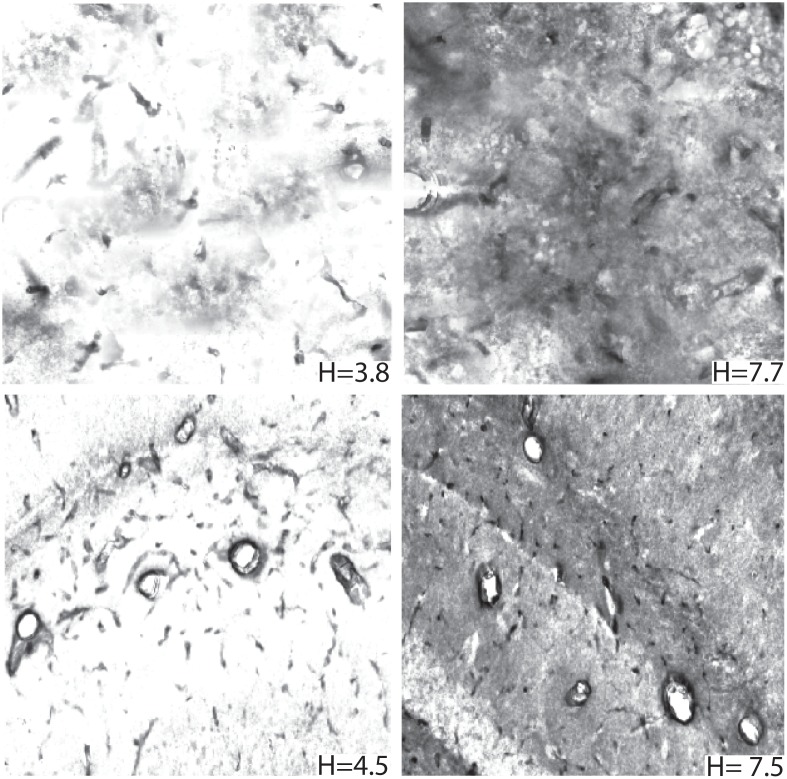
In this paper, we present an objective method for localization of proteins in blood brain barrier (BBB) vasculature using standard immunohistochemistry (IHC) techniques and bright-field microscopy. Images from the hippocampal region at the BBB are acquired using bright-field microscopy and subjected to our segmentation pipeline which is designed to automatically identify and segment microvessels containing the protein glucose transporter 1 (GLUT1). Gabor filtering and k-means clustering are employed to isolate potential vascular structures within cryosectioned slabs of the hippocampus, which are subsequently subjected to feature extraction followed by classification via decision forest. The false positive rate (FPR) of microvessel classification is characterized using synthetic and non-synthetic IHC image data for image entropies ranging between 3 and 8 bits. The average FPR for synthetic and non-synthetic IHC image data was found to be 5.48% and 5.04%, respectively.


Conflict of interest statement

Competing Interests: The authors have declared that no competing interests exist.

Figures

Fig 1
Fig 1. Overview of the workflow.
Input immunohistochemistry (IHC) images are pre-segmented to identify candidate structures of interest, which are represented within a generated mask image. Candidate structures within the mask image are filtered using a decision tree derived from training sessions to produce a fully segmented IHC image. For further details, see text.
Fig 2
Fig 2. Real parts of the Gabor filter bank.
Generated for different combinations of θ (in radians) and f (in Hz) with η=2, γ=2 and ϕ = 0.
Fig 3
Fig 3. Pixel-wise classification of the hippocampal region using k-means clustering.
White pixels mark regions potentially containing vascular structures of interest. Black pixels mark non-vascular structures.
Fig 4
Fig 4. Image Entropy Range and False Positive Rate of microvessel classification.
(top) Boxplot showing the median, standard deviation, and range of entropy values for both synthetic and non-synthetic datasets. (bottom) False positive rate (FPR) of microvessel classification for synthetic and non-synthetic IHC images as a function of image entropy.
Fig 5
Fig 5. GLUT1 stained image examples.
(top) Synthetic and (bottom) non-synthetic images with varying global pixel entropy (H) Local spatial frequency tends to increase with local entropy. IHC images with higher H usually exhibit more spatially complex surface geometries and/or possess increased surface noise due to the staining protocol.
Fig 6
Fig 6. Example result given by the segmentation algorithm.
Shown is an IHC image plane within the bregma stained for GLUT1 expression in vascular structures. Green contours identify microvessels exhibiting significant GLUT1 concentration.
Fig 7
Fig 7. False negative classification rate.
FNR of microvessel classification for synthetic data as a function of image entropy. Average FNR = 7.49.
Fig 8
Fig 8. Processing time.
The red line marks 5 megapixels, which correlates to the 2592×1944 brightfield IHC images acquired.
Fig 9
Fig 9. Example result given by the segmentation algorithm when a 40× image is input.
Green contours identify microvessels exhibiting significant stain concentration.

References

    1. Van Vliet E, da Costa Araujo S, Redeker S, Van Schaik R, Aronica E, Gorter J. Blood–brain barrier leakage may lead to progression of temporal lobe epilepsy. Brain. 2007;130(2):521–534. 10.1093/brain/awl318 - DOI - PubMed
    1. Deane R, Zlokovic BV. Role of the Blood-Brain Barrier in the pathogenesis of Alzheimers disease. Current Alzheimer Research. 2007;4(2):191–197. 10.2174/156720507780362245 - DOI - PubMed
    1. Zlokovic BV. The blood-brain barrier in health and chronic neurodegenerative disorders. Neuron. 2008;57(2):178–201. 10.1016/j.neuron.2008.01.003 - DOI - PubMed
    1. Kortekaas R, Leenders KL, van Oostrom JC, Vaalburg W, Bart J, Willemsen A, et al. Blood–brain barrier dysfunction in parkinsonian midbrain in vivo. Annals of neurology. 2005;57(2):176–179. 10.1002/ana.20369 - DOI - PubMed
    1. Ting CY, Fan CH, Liu HL, Huang CY, Hsieh HY, Yen TC, et al. Concurrent blood–brain barrier opening and local drug delivery using drug-carrying microbubbles and focused ultrasound for brain glioma treatment. Biomaterials. 2012;33(2):704–712. 10.1016/j.biomaterials.2011.09.096 - DOI - PubMed

Publication types

Substances

LinkOut - more resources