. 2016 Feb 1;11(2):e0148230.
doi: 10.1371/journal.pone.0148230. eCollection 2016.

The Genetic Architecture of Murine Glutathione Transferases

Affiliations

The Genetic Architecture of Murine Glutathione Transferases

Lu Lu et al. PLoS One. .

Abstract

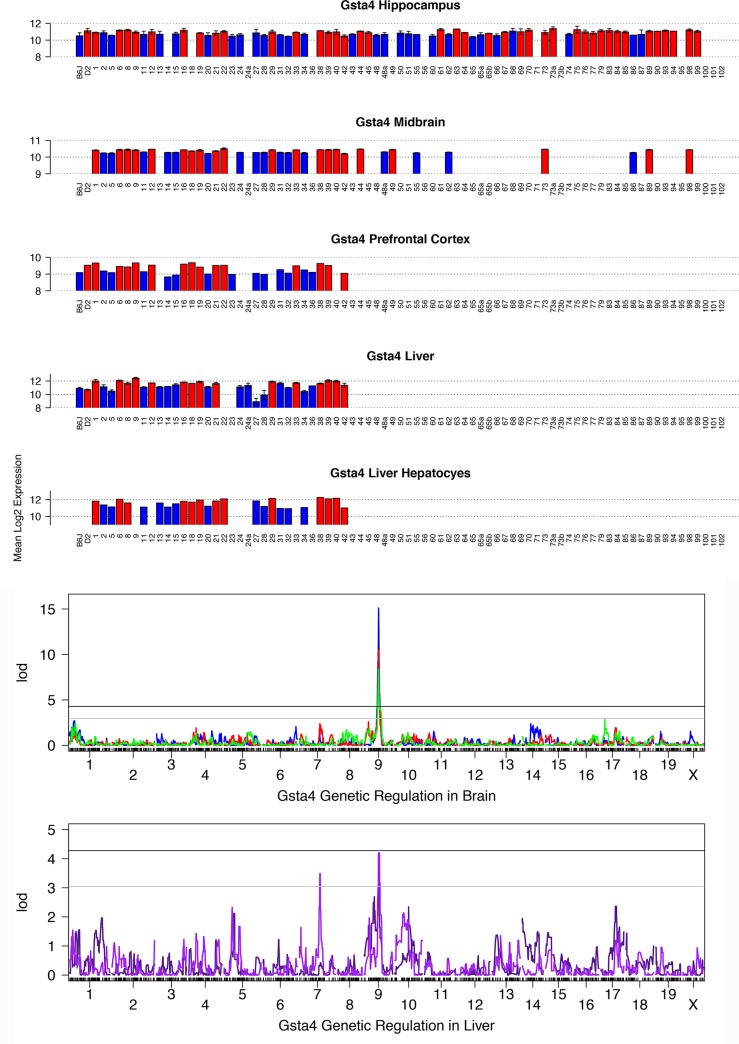
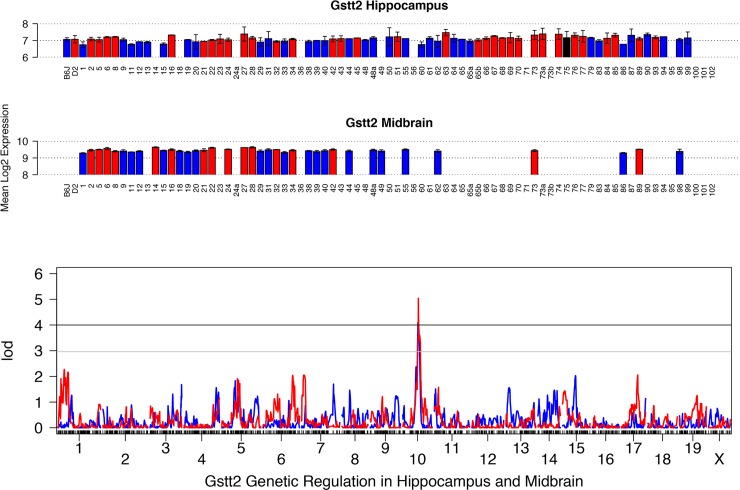
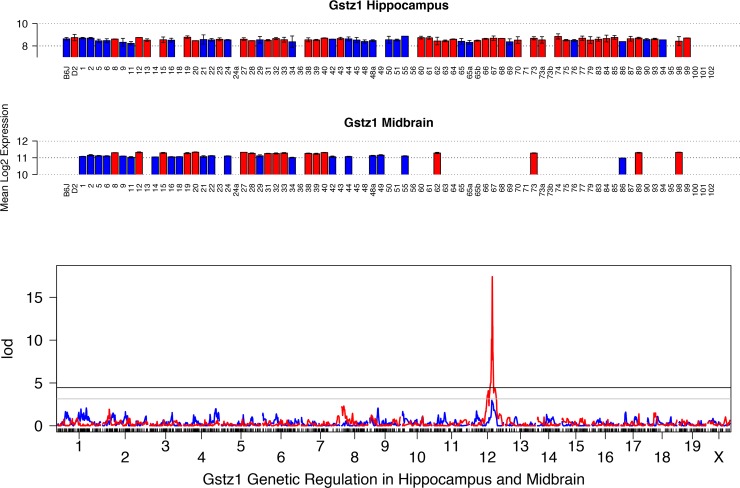
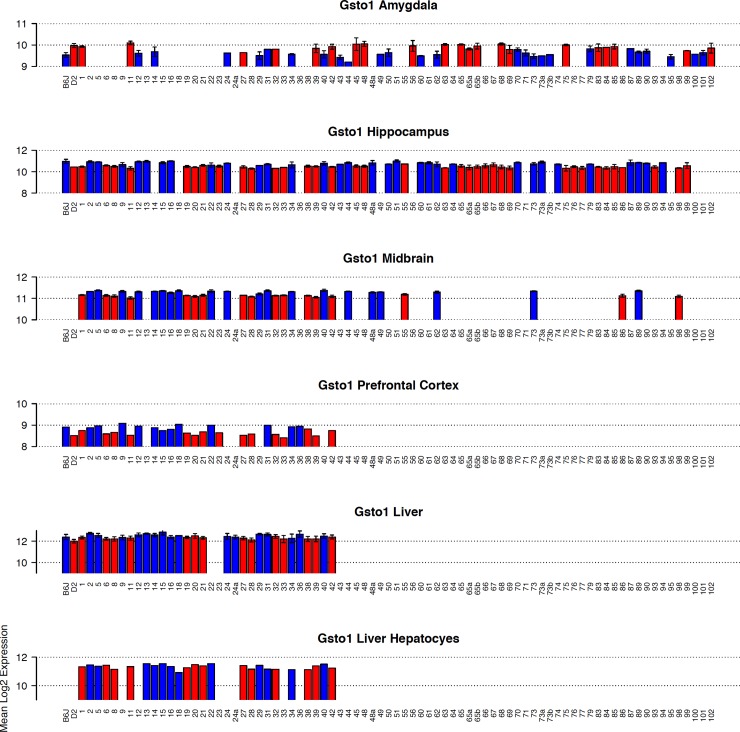
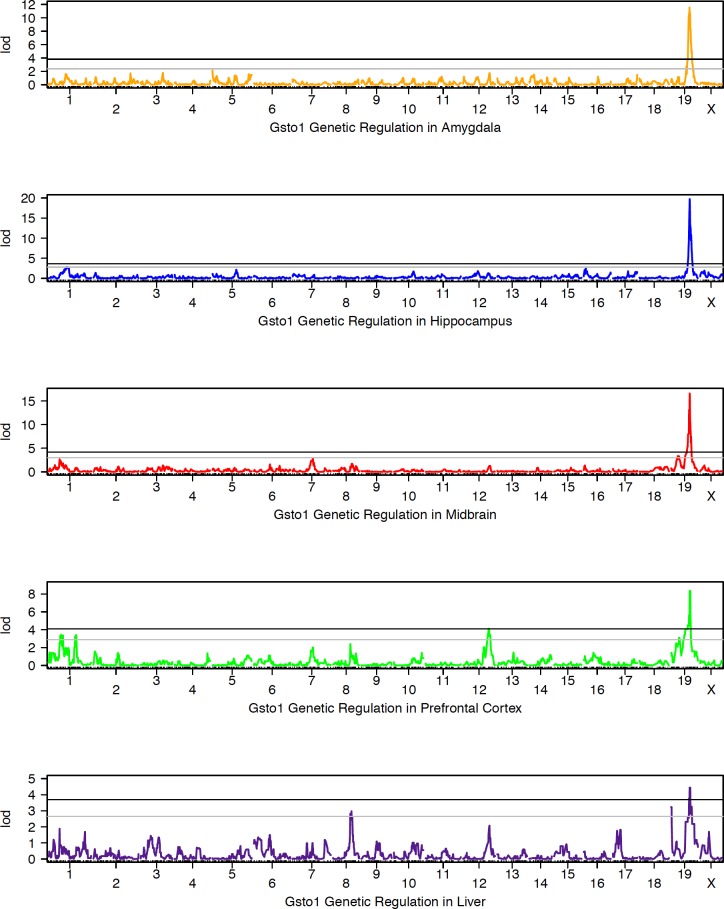
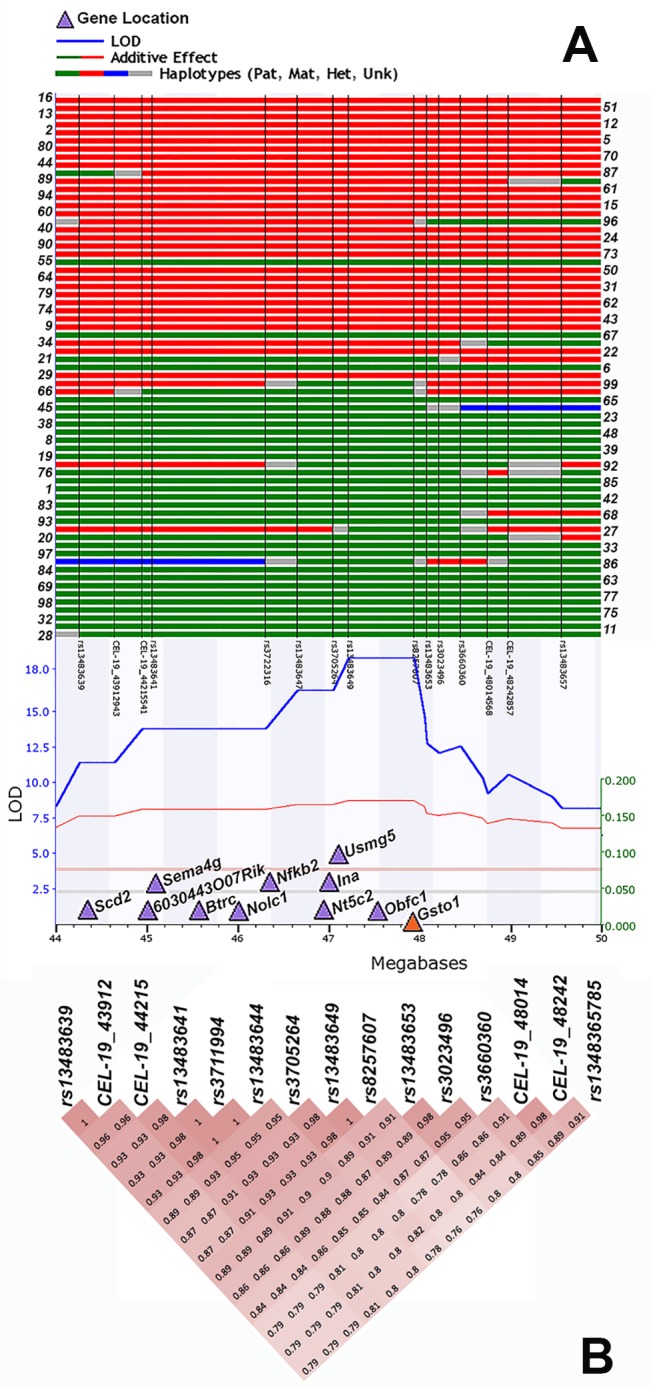
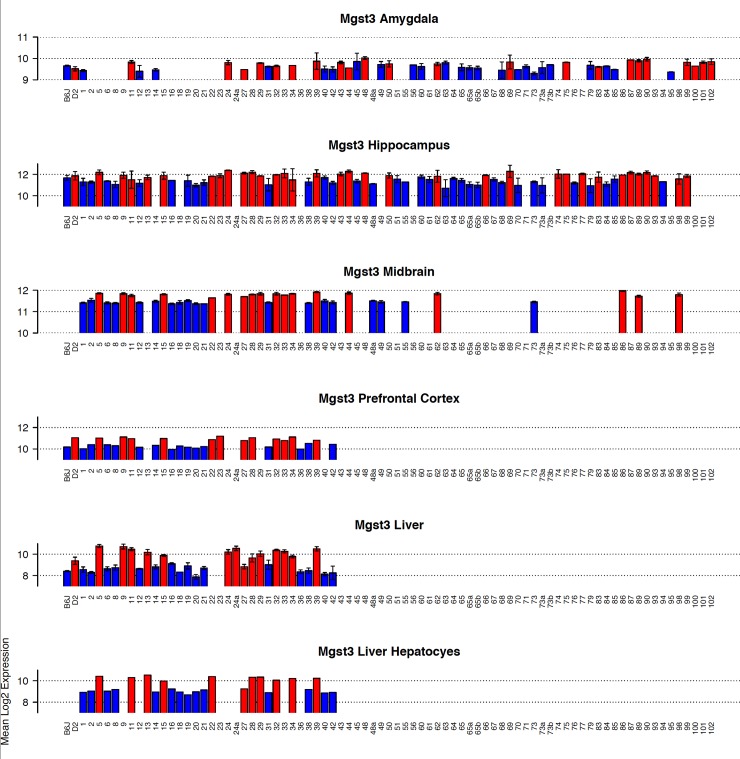
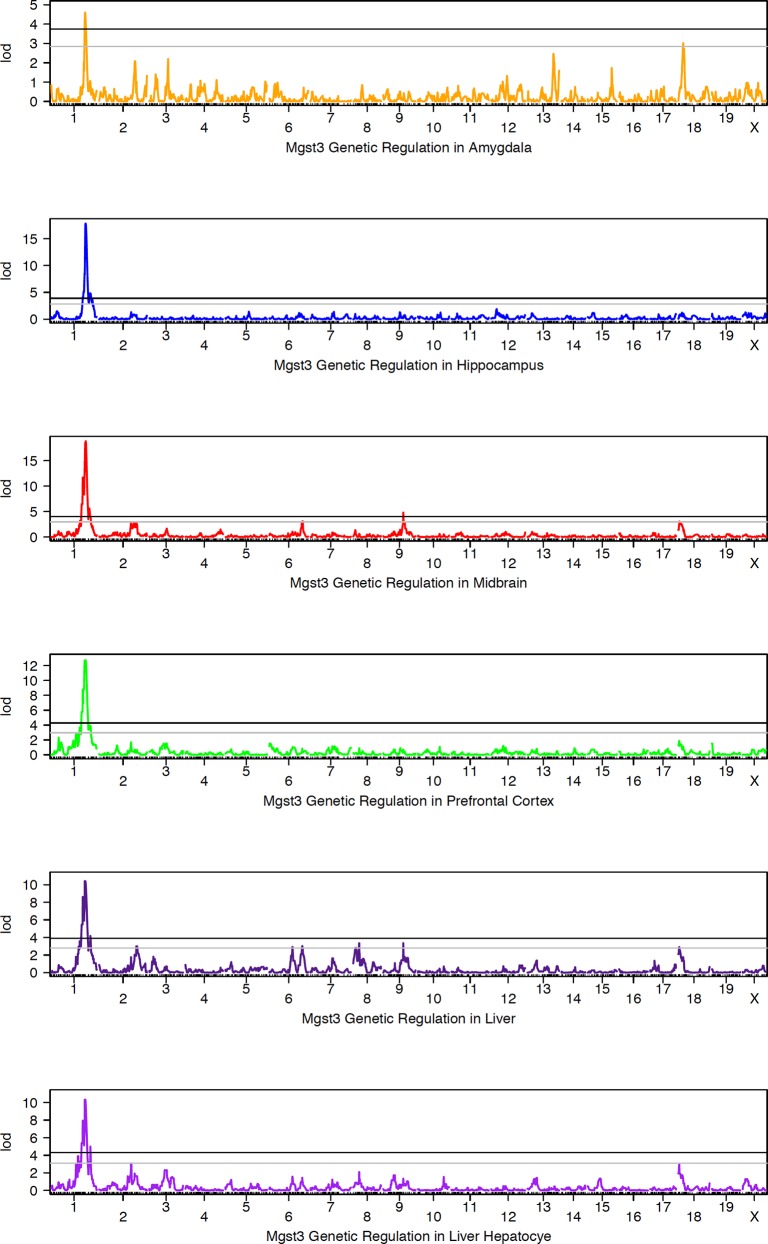
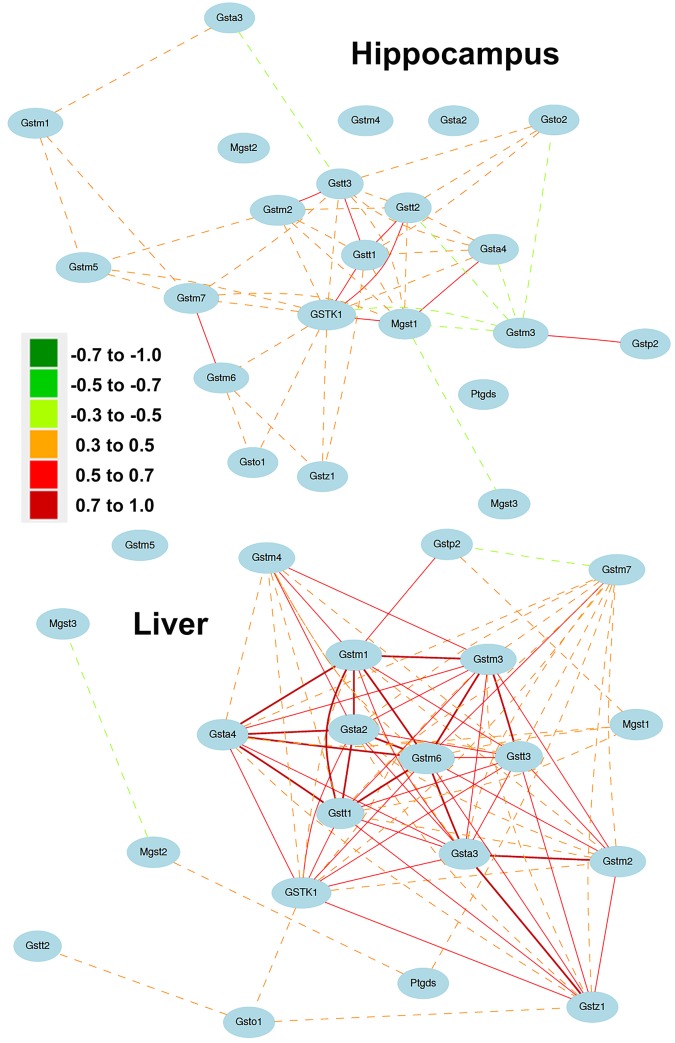
Glutathione S-transferase (GST) genes play a protective role against oxidative stress and may influence disease risk and drug pharmacokinetics. In this study, massive multiscalar trait profiling across a large population of mice derived from a cross between C57BL/6J (B6) and DBA2/J (D2)--the BXD family--was combined with linkage and bioinformatic analyses to characterize mechanisms controlling GST expression and to identify downstream consequences of this variation. Similar to humans, mice show a wide range in expression of GST family members. Variation in the expression of Gsta4, Gstt2, Gstz1, Gsto1, and Mgst3 is modulated by local expression QTLs (eQTLs) in several tissues. Higher expression of Gsto1 in brain and liver of BXD strains is strongly associated (P < 0.01) with inheritance of the B6 parental allele whereas higher expression of Gsta4 and Mgst3 in brain and liver, and Gstt2 and Gstz1 in brain is strongly associated with inheritance of the D2 parental allele. Allele-specific assays confirmed that expression of Gsto1, Gsta4, and Mgst3 are modulated by sequence variants within or near each gene locus. We exploited this endogenous variation to identify coexpression networks and downstream targets in mouse and human. Through a combined systems genetics approach, we provide new insight into the biological role of naturally occurring variants in GST genes.


Conflict of interest statement

Competing Interests: The authors have declared that no competing interests exist.

Figures

Fig 1
Fig 1. Summary of expression and QTL mapping across BXD strains for Gsta4.
The top five panels contain bar plots representing the expression of Gsta4 for each BXD individual in five different tissues. Average log2 expression is shown on the y-axis and unique strains are shown on the X-axis (BXD1 = 1). Red and blue indicate inheritance of the paternal D2 (D) or maternal B6 (B) allele of Gsta4 in each strain, respectively. If only a single individual was used for expression measurements, error bars are not shown. For genetic reference populations, mapping power is derived from the number of individuals as opposed to the number of biological replicates. Higher expression is associated with inheritance of the D allele. Bottom two panels show the genetic mapping results in each tissue. Association strength (LOD) is shown on the Y-axis and plotted across the genome on the X-axis (by chromosome) for hippocampus (blue), midbrain (red), prefrontal cortex (green), liver (dark purple), and hepatocytes (purple). Genome-wide significance is determined by permutation (n = 5000) with the threshold for significance indicated as black (significant, p <0.05) and grey (suggestive, p < 0.3) horizontal lines. Expression of Gsta4 is modulated by variants within or near its own locus on Chr 9, a cis eQTL.
Fig 2
Fig 2. Summary of expression and QTL mapping across BXD strains for Gstt2.
Top two panels (bar plots) show expression of Gstt2 in each BXD strain in hippocampus and midbrain. Average log2 expression is shown on the y-axis and unique strains are shown on the X-axis. Red and blue indicate inheritance of the paternal D or maternal B allele of Gsta4 in each strain, respectively. Black indicates a heterozygous (likely erroneous) genotype call. Higher expression is associated with inheritance of the D allele. Bottom panel shows the genetic mapping results in each tissue. Association strength (LOD) is shown on the Y-axis and plotted across the genome on the X-axis (by chromosome) for hippocampus (blue) and midbrain (red). Genome-wide significance is determined by permutation (n = 5000) with the threshold for significance indicated as black (significant, p <0.05) and grey (suggestive, p < 0.3) horizontal lines. Expression of Gstt2 is modulated by variants within or near its own locus on Chr 10, a cis eQTL.
Fig 3
Fig 3. Summary of expression and QTL mapping across BXD strains for Gstz1.
Top two panels (bar plots) show expression of Gstz1 in each BXD strain in hippocampus and midbrain. Average log2 expression is shown on the y-axis and unique strains are shown on the X-axis. Red and blue indicate inheritance of the paternal D or maternal B allele of Gstz1 in each strain, respectively. Higher expression is associated with inheritance of the D allele. Bottom panel shows the genetic mapping results in each tissue. Association strength (LOD) is shown on the Y-axis and plotted across the genome on the X-axis (by chromosome) for hippocampus (blue) and midbrain (red). Genome-wide significance is determined by permutation (n = 5000) with the threshold for significance indicated as black (significant, p <0.05) and grey (suggestive, p < 0.3) horizontal lines. Expression of Gstz1 is modulated by variants within or near its own locus on Chr 12, a cis eQTL.
Fig 4
Fig 4. Summary of Gsto1 expression across BXD strains.
Panels (bar plots) show expression of Gsto1 in each BXD strain in multiple tissues. Average log2 expression is shown on the y-axis and unique strains are shown on the X-axis. Red and blue indicate inheritance of the paternal D or maternal B allele of Gsto1 in each strain, respectively. If only a single individual was used for expression measurements, error bars are not shown. For genetic reference populations, mapping power is derived from the number of individuals as opposed to the number of biological replicates. Higher expression is associated with inheritance of the B allele.
Fig 5
Fig 5. Summary of QTL mapping of Gsto1 expression across BXD strains.
Genetic mapping results are shown for brain and peripheral tissue. Association strength (LOD) is shown on the Y-axis and plotted across the genome on the X-axis (by chromosome) in each QTL map. Genome-wide significance is determined by permutation (n = 5000) with the threshold for significance indicated as black (significant, p <0.05) and grey (suggestive, p < 0.3) horizontal lines. Expression of Gsto1 is modulated by variants within or near its own locus on Chr 19, a cis eQTL.
Fig 6
Fig 6. Summary of recombination and linkage disequilibrium near the Gsto1 locus.
(A) The association score (LOD) (y-axis) for Gsto1 expression in the hippocampus is plotted as a solid blue line across the genome (x-axis) with horizontal lines indicating significance thresholds for significant (red) and suggestive (grey) LOD values. The physical position of Gsto1 is indicated by the orange triangle and the locations of other cis-modulated genes are shown as light purple triangles. Haplotypes are shown above the linkage map for BXD strains with strain number shown to the right and left of the haplotypes. Vertical black lines designate marker position with marker names below the haplotype map. Red and green blocks indicate a chromosomal region inherited from the maternal B6 or paternal D2 strain, respectively. Blue areas are heterozygous and grey areas are undefined meaning that more markers would be needed to pinpoint the exact recombination breakpoint. As expected for a recombinant inbred population, this region is primarily inherited as an entire haplotype block from either parental strain. (B) Pairwise correlations between markers in the region are shown. Intensity reflects correlation strength. Markers in this region are tightly linked.
Fig 7
Fig 7. Summary of Mgst3 expression across BXD strains.
Panels (bar plots) show expression of Mgst3 in each BXD strain in multiple tissues. Average log2 expression is shown on the y-axis and unique strains are shown on the X-axis. Red and blue indicate inheritance of the paternal D or maternal B allele in each strain, respectively. If only a single individual was used for expression measurements, error bars are not shown. For genetic reference populations, mapping power is derived from the number of individuals as opposed to the number of biological replicates. Higher expression is associated with inheritance of the D allele.
Fig 8
Fig 8. Summary of QTL mapping of Mgst3 expression across BXD strains.
Genetic mapping results are shown for brain and peripheral tissue. Association strength (LOD) is shown on the Y-axis and plotted across the genome on the X-axis (by chromosome) in each QTL map. Genome-wide significance is determined by permutation (n = 5000) with the threshold for significance indicated as black (significant, p <0.05) and grey (suggestive, p < 0.3) horizontal lines. Expression of Mgst3 is modulated by variants within or near its own locus (distal Chr 1), a cis eQTL.
Fig 9
Fig 9. GST coexpression networks in brain and liver.
Top and bottom panels show GST coexpression networks in hippocampus and liver, respectively. Positive correlations are indicated by warm line (edge) colors and negative correlations are indicated by cool edge colors. In addition, correlations greater than |0.7| are indicated as bold lines and those less than |0.5| are indicated by dashed lines. All correlations are greater than |0.3|. The expression of many GST genes is positively correlated.

Similar articles

Cited by

References

    1. Deponte M (2013) Glutathione catalysis and the reaction mechanisms of glutathione-dependent enzymes. Biochim Biophys Acta 1830: 3217–3266. 10.1016/j.bbagen.2012.09.018 - DOI - PubMed
    1. Hayes JD, Flanagan JU, Jowsey IR (2005) Glutathione transferases. Annu Rev Pharmacol Toxicol 45: 51–88. - PubMed
    1. Lu SC (2013) Glutathione synthesis. Biochim Biophys Acta 1830: 3143–3153. 10.1016/j.bbagen.2012.09.008 - DOI - PMC - PubMed
    1. Mannervik B, Danielson UH (1988) Glutathione transferases—structure and catalytic activity. CRC Crit Rev Biochem 23: 283–337. - PubMed
    1. Board PG (1981) Transport of glutathione S-conjugate from human erythrocytes. FEBS Lett 124: 163–165. - PubMed

Publication types