

Assessment of the Geographic Distribution of Ornithodoros turicata (Argasidae): Climate Variation and Host Diversity
- PMID: 26829327
- PMCID: PMC4734830
- DOI: 10.1371/journal.pntd.0004383
Assessment of the Geographic Distribution of Ornithodoros turicata (Argasidae): Climate Variation and Host Diversity
Erratum in
-
Correction: Assessment of the Geographic Distribution of Ornithodoros turicata (Argasidae): Climate Variation and Host Diversity.PLoS Negl Trop Dis. 2016 Mar 8;10(3):e0004538. doi: 10.1371/journal.pntd.0004538. eCollection 2016 Mar. PLoS Negl Trop Dis. 2016. PMID: 26953571 Free PMC article. No abstract available.
Abstract
Background: Ornithodoros turicata is a veterinary and medically important argasid tick that is recognized as a vector of the relapsing fever spirochete Borrelia turicatae and African swine fever virus. Historic collections of O. turicata have been recorded from Latin America to the southern United States. However, the geographic distribution of this vector is poorly understood in relation to environmental variables, their hosts, and consequently the pathogens they transmit.
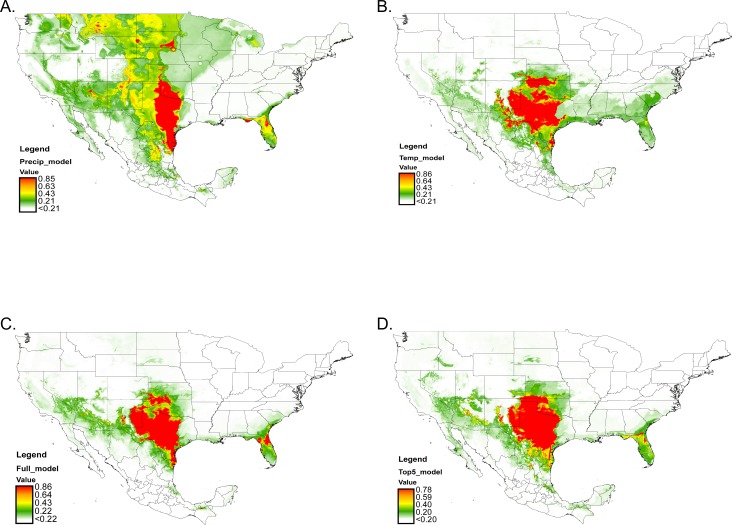
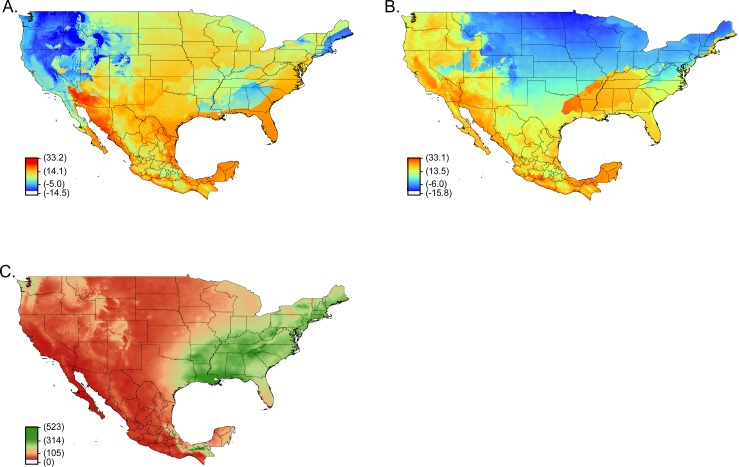
Methodology: Localities of O. turicata were generated by performing literature searches, evaluating records from the United States National Tick Collection and the Symbiota Collections of Arthropods Network, and by conducting field studies. Maximum entropy species distribution modeling (Maxent) was used to predict the current distribution of O. turicata. Vertebrate host diversity and GIS analyses of their distributions were used to ascertain the area of shared occupancy of both the hosts and vector.
Conclusions and significance: Our results predicted previously unrecognized regions of the United States with habitat that may maintain O. turicata and could guide future surveillance efforts for a tick capable of transmitting high-consequence pathogens to human and animal populations.
Conflict of interest statement
The authors have declared that no competing interests exist.
Figures


References
-
- Dworkin M, Schwan T, Anderson D (2002) Tick-borne relapsing fever in North America. Med Clin North Am 86: 417–433. - PubMed
-
- Felsenfeld O (1973) The problem of relapsing fever in the Americas. IMS Ind Med Surg 42: 7–10. - PubMed
-
- Manzano-Román R, Díaz-Martín V, de la Fuente J, Pérez-Sánchez R (2012) Soft ticks as pathogen vectors: distribution, surveillance and control. In: Manjur Shah M, editor. Parasitology.
-
- Cooley R, Kohls G (1944) The Agarasidae of North America, Central America, and Cuba. Am Midl Nat Monogr No 1: 1–152.
Publication types
MeSH terms
LinkOut - more resources
Full Text Sources
Other Literature Sources
