. 2016 Mar;18(3):303-10.
doi: 10.1038/ncb3307. Epub 2016 Feb 1.

β-Arrestin drives MAP kinase signalling from clathrin-coated structures after GPCR dissociation

Affiliations

β-Arrestin drives MAP kinase signalling from clathrin-coated structures after GPCR dissociation

K Eichel et al. Nat Cell Biol. 2016 Mar.

Abstract

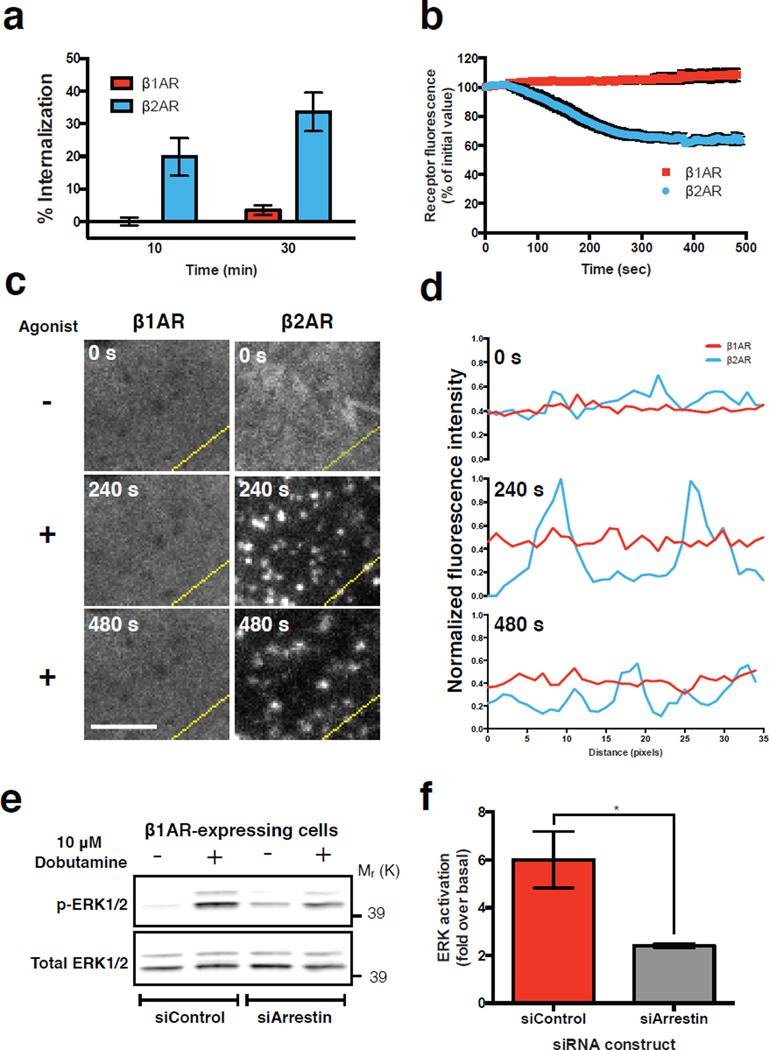
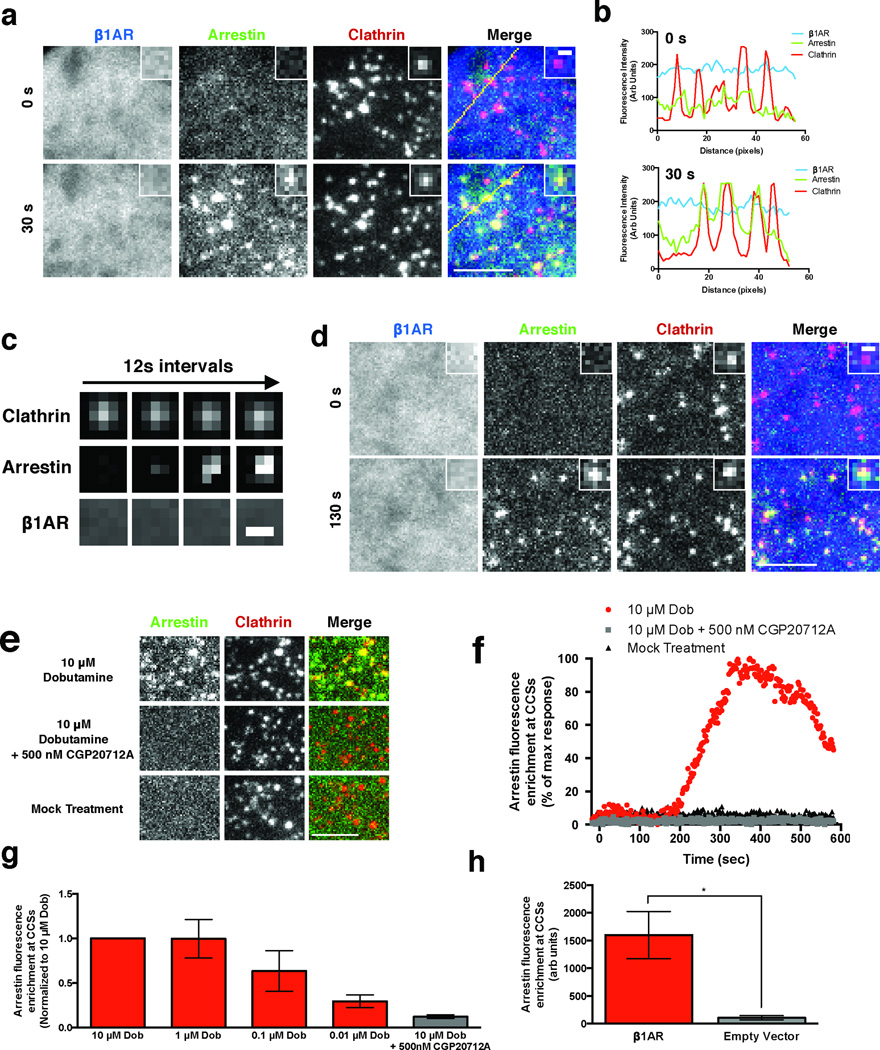
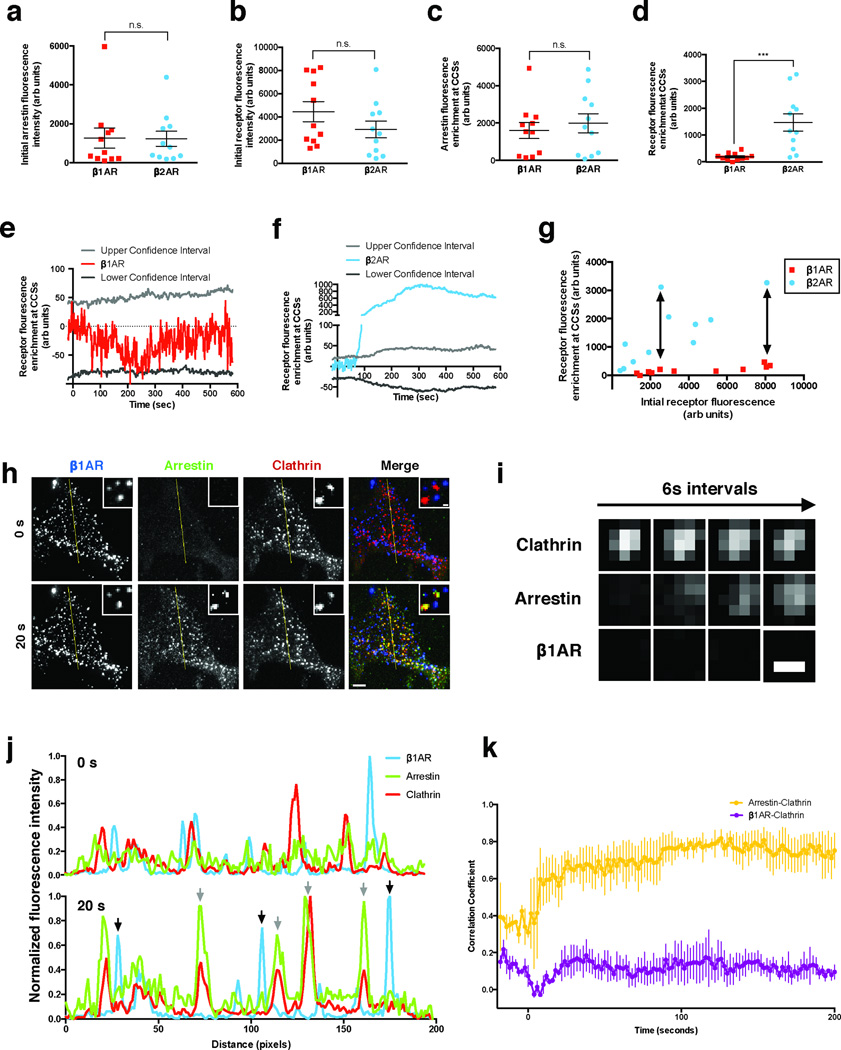
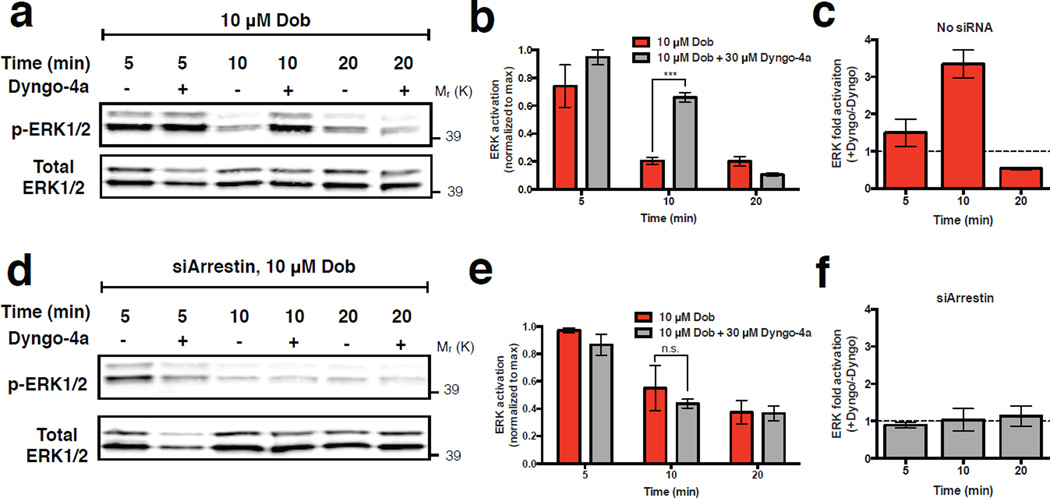
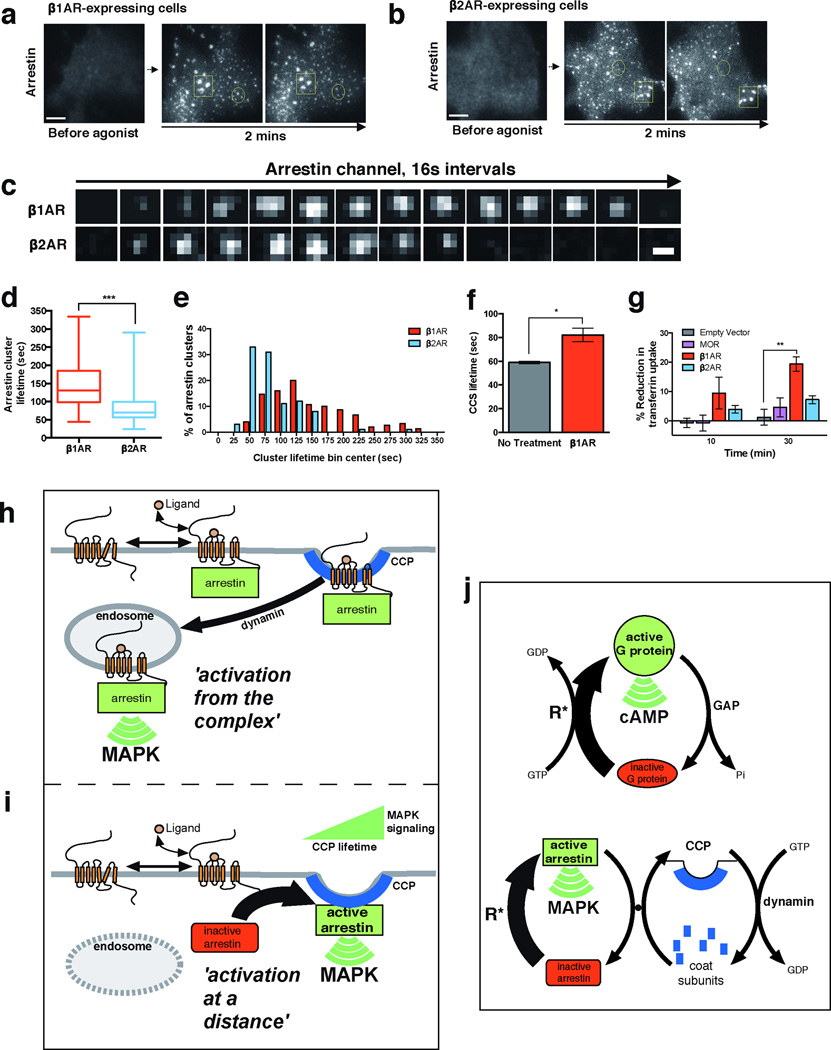
β-Arrestins critically regulate G-protein-coupled receptor (GPCR) signalling, not only 'arresting' the G protein signal but also modulating endocytosis and initiating a discrete G-protein-independent signal through MAP kinase. Despite enormous recent progress towards understanding biophysical aspects of arrestin function, arrestin cell biology remains relatively poorly understood. Two key tenets underlie the prevailing current view: β-arrestin accumulates in clathrin-coated structures (CCSs) exclusively in physical complex with its activating GPCR, and MAP kinase activation requires endocytosis of formed GPCR-β-arrestin complexes. We show here, using β1-adrenergic receptors, that β-arrestin-2 (arrestin 3) accumulates robustly in CCSs after dissociating from its activating GPCR and transduces the MAP kinase signal from CCSs. Moreover, inhibiting subsequent endocytosis of CCSs enhances the clathrin- and β-arrestin-dependent MAP kinase signal. These results demonstrate β-arrestin 'activation at a distance', after dissociating from its activating GPCR, and signalling from CCSs. We propose a β-arrestin signalling cycle that is catalytically activated by the GPCR and energetically coupled to the endocytic machinery.


Figures

Figure 1
Figure 1. β1ARs do not cluster or internalize but initiate β-arrestin-2 -dependent activation of ERK1/2
(a) Flow cytometric analysis of FLAG-tagged receptor internalization after exposure of cells to 10 μM isoproterenol for 10 or 30 min (n = 3 independent experiments; 30,000 cells per experiment). (b) Average surface receptor fluorescence after 10 μM isoproterenol treatment in TIR-FM live cell images. (n = 11 cells pooled across 3 independent experiments) (c) Frames of a representative area of cells expressing FLAG-tagged receptors and imaged live with TIR-FM at the indicated time after agonist addition. Scale bar = 5 μm. (d) Fluorescence intensity profiles of FLAG-tagged receptors from lines shown in (c). (e-f) ERK1/2 activation in β1AR-expressing cells. (e) Representative western blot of total and phosphorylated ERK1/2 after 5 minutes of agonist treatment in cells with siRNA treatment as indicated. (f) Quantification of ERK1/2 activation by normalizing phosphorylated ERK1/2 to total ERK1/2 and determining fold over untreated (n = 3 independent experiments, * p = 0.0386 by two-tailed t-test). Error bars correspond to SEM. Raw data of independent repeats are in Supplementary Table 1. Panels c, d, and e show results that are representative from 3 independent experiments. Uncropped western blot scans are shown in Supplementary Fig. 6.
Figure 2
Figure 2. β1ARs drive β-arrestin-2 trafficking to CCSs separately from receptors
(a) Representative images of HEK 293 cells co-expressing FLAG-β1AR (blue), β-arrestin-2-GFP (green), and clathrin light chain-DsRed (red) and imaged live with TIR-FM. Frames captured immediately before (0 s) and 30 seconds after (30 s) bath application of 10 μM dobutamine are shown. Insets show a representative region at higher magnification. Large image scale bar = 5 μm; inset scale bar = 500 nm. (b) Fluorescence intensity profiles from lines shown in (a). (c) Representative time lapse series showing β-arrestin-2 clustering into pre-existing CCSs without β1AR accumulation in CCSs. Images were collected at 0.5 Hz and, for brevity of presentation, one in six frames (12 sec interval) are shown. Scale bar = 500 nm (d) Representative images of COS cells co-expressing FLAG-β1AR (blue), β-arrestin-2-GFP (green), and clathrin light chain-DsRed (red) and imaged live with TIR-FM. Frames captured immediately before (0 s) and 130 seconds after (130 s) bath application of 10 μM dobutamine are shown. Insets show a representative region at higher magnification. Large image scale bar = 5 μm; inset scale bar = 500 nm. (e) Representative images of cells co-expressing FLAG-β1AR, β-arrestin-2-GFP (green), and clathrin light chain-DsRed (red) and imaged live with TIR-FM. Frames shown are after the indicated treatments: 10 μM dobutamine (top), pretreatment with CGP20712A and then 10 μM dobutamine (middle), and mock treatment (bottom). Scale bar = 5 μm. (f) Arrestin enrichment at CCSs for the indicated cells shown in (e). (g) Average maximum arrestin enrichment at CCSs after the indicated treatment normalized to 10 μM dobutamine response (n = 4 cells pooled across 2 independent experiments). (h) Average maximum arrestin enrichment at CCSs in cells expressing either FLAG-β1AR or empty vector after 10 μM dobutamine treatment (n = 11 cells for β1AR pooled across 3 independent experiments or 5 cells for empty vector pooled across 2 independent experiments, * p = 0.036 by two-tailed t-test). Error bars represent SEM. Raw data from independent repeats are in Supplementary Table 1.
Figure 3
Figure 3. β1ARs drive β-arrestin-2 trafficking to CCSs even when laterally immobilized
(a & b) Initial fluorescence intensity of β-arrestin-2 (a) and receptor (b). (c & d) Maximum arrestin (c) or receptor (d) fluorescence enrichment at CCSs in cells expressing β-arrestin-2-GFP, clathrin light chain-DsRed, and either FLAG-β1AR or FLAG-β2AR after treatment with 10 μM dobutamine or 10 μM isoproterenol, respectively. *** p = 0.0009 by two-tailed t-test. (e & f) Average FLAG-β1AR (e) or FLAG-β2AR (f) enrichment at CCSs after treatment with 10 μM dobutamine or 10 μM isoproterenol, respectively. 5th and 95th confidence intervals for significant fluorescence enrichment are shown for each receptor. (g) Maximum receptor enrichment at CCSs as a function of receptor fluorescence when imaged under identical conditions. Arrows indicate expression matched cells that have disparate enrichment at CCSs. (h) Representative TIR-FM images of cells expressing super ecliptic pHluorin (SEP)-β1AR (blue), β-arrestin-2-mApple (green), and clathrin light chain-TagBFP (red) after immobilizing β1ARs with polyclonal antibodies prior to imaging. Frames collected immediately before (0 s) and 20 seconds after (20 s) application of 10 μM dobutamine are shown. Insets show a representative region at higher magnification. Large image scale bar = 5 μm; inset scale bar = 500 nm. (i) Representative time lapse series showing β-arrestin-2 clustering into pre-existing CCSs while immobilized β1ARs do not concentrate in CCSs. Images were collected at 0.5 Hz and, for brevity of presentation, one in three frames (6 sec interval) are shown. Scale bar = 500 nm. (j) Fluorescence intensity profiles from lines shown in (h). Gray arrows indicate arrestin and clathrin overlap. Black arrows indicate immobilized β1ARs without arrestin overlap. (k) Time-dependent correlation coefficient of line scans across cells. Error bars represent SEM. Uncropped original scans of western blots are shown in Supplementary Fig. 6. a-g are representative of 11 cells per condition pooled across 3 independent experiments, k is representative of 3 independent experiments, and raw data from independent repeats are in Supplementary Table 1.
Figure 4
Figure 4. Surface lifetime of CCSs regulates magnitude and duration of the β-arrestin-2-dependent ERK1/2 signal
(a) Representative western blot showing phosphorylated ERK1/2 and total ERK1/2 signal in extracts prepared after pre-incubating cells in the absence or presence of 30 μM Dyngo-4a, as indicated, and exposed to 10 μM dobutamine for the indicated time period. (b) Quantification of ERK1/2 activation from western blots in (a). Phosphorylated ERK1/2 band intensity is normalized to ERK1/2 total band intensity and shown as fraction of maximum response observed in each independent experiment. *** p = 0.0001 by two-tailed t-test. (c) Dyngo-4a dependent fold activation of ERK1/2, determined after the indicated time period of dobutamine exposure, in cells expressing β-arrestin-2 at native levels. (d & e) The equivalent experiment of a & b conducted in cells in which β-arrestin-2 was depleted using siRNA. (f) Dyngo-4a dependent fold activation of ERK1/2, determined after the indicated time period of dobutamine exposure, in cells expressing β-arrestin-2 after siRNA-mediated knockdown. ERK1/2 activation in cells treated with Dyngo-4a was normalized to ERK1/2 activation in cells without Dyngo-4a treatment to determine the specific effect of Dyngo-4a. Error bars correspond to SEM. For a-f , n = 4 independent experiments. Raw data from independent repeats are provided in Supplementary Table 1.
Figure 5
Figure 5. β1AR-elicited control of β-arrestin and CME dynamics underlies signaling
(a & b) Activation of FLAG-β1ARs (a) or FLAG-β2ARs (b) produced similar recruitment of β-arrestin-2-GFP to CCSs. Circled examples indicate diffraction-limited spots representing individual CCSs. Squared examples indicate structures larger than the diffraction limit that were excluded from analysis as they represent groups of CCSs or clathrin plaques. Scale bar = 5 μm. (c) Representative image series of individual arrestin-associated CCSs observed by TIR-FM after β1AR (top row) or β2AR (bottom row) activation. Images were collected at 0.5 Hz and, for brevity of presentation, one in eight frames (16 sec interval) are shown. Scale bar = 500 nm. (d) Average surface lifetime of β-arrestin-2 clusters after indicated receptor activation (whiskers represent min and max, boxplot represents median, and 25th and 75th quartiles; n = 150 CCSs pooled across 3 independent experiments for β1AR and n = 100 CCSs pooled across 2 independent experiments for β2AR, *** p = 0.0001). (e) Frequency distribution analysis of β-arrestin-2 surface lifetimes shown in (d). (f) Automated cmeAnalysis of CCS lifetimes in cells expressing FLAG-β1ARs with and without 10 μM dobutamine treatment (n = 3 independent experiments, * p = 0.0165). (g) Cellular uptake of transferrin after indicated receptor activation (n = 3 independent experiments, ** p = 0.0025). Error bars represent SEM, p values calculated by a two-tailed t-test. Raw data from independent repeats are provided in Supplementary Table 1. (h and i) Schematic summarizing the previous paradigm for β-arrestin function, based on ‘activation from the complex’ (panel h). The different mode of β-arrestin trafficking and signaling, ‘activation at a distance’, which is demonstrated in the present study (panel i). Here, β-arrestin operates after dissociating from its activating GPCR rather than in physical complex with it, and the ERK signal is initiated from CCSs rather than endosomes. (j) Schematic of conventional G protein signaling mechanism based on allosteric coupling to GTP hydrolysis (top diagram) and the proposed β-arrestin signaling mechanism based on intermolecular coupling to the CME cycle (bottom diagram). Activated GPCR form(s) catalyzing the indicated conformational activations are denoted as R*.

Comment in

References

    1. Shukla AK, Xiao K, Lefkowitz RJ. Emerging paradigms of beta-arrestin-dependent seven transmembrane receptor signaling. Trends Biochem Sci. 2011;36:457–469. - PMC - PubMed
    1. Benovic JL, et al. Functional desensitization of the isolated beta-adrenergic receptor by the beta-adrenergic receptor kinase: potential role of an analog of the retinal protein arrestin (48-kDa protein) Proc Natl Acad Sci U S A. 1987;84:8879–8882. - PMC - PubMed
    1. Marchese A, Chen C, Kim YM, Benovic JL. The ins and outs of G protein-coupled receptor trafficking. Trends Biochem Sci. 2003;28:369–376. - PubMed
    1. Shukla AK, et al. Visualization of arrestin recruitment by a G-protein-coupled receptor. Nature. 2014;512:218–222. - PMC - PubMed
    1. Kang Y, et al. Crystal structure of rhodopsin bound to arrestin by femtosecond X-ray laser. Nature. 2015;523:561–567. - PMC - PubMed