. 2016 Feb 1;12(2):e1005408.
doi: 10.1371/journal.ppat.1005408. eCollection 2016 Feb.

IFNs Modify the Proteome of Legionella-Containing Vacuoles and Restrict Infection Via IRG1-Derived Itaconic Acid

Affiliations

IFNs Modify the Proteome of Legionella-Containing Vacuoles and Restrict Infection Via IRG1-Derived Itaconic Acid

Jan Naujoks et al. PLoS Pathog. .

Abstract

Macrophages can be niches for bacterial pathogens or antibacterial effector cells depending on the pathogen and signals from the immune system. Here we show that type I and II IFNs are master regulators of gene expression during Legionella pneumophila infection, and activators of an alveolar macrophage-intrinsic immune response that restricts bacterial growth during pneumonia. Quantitative mass spectrometry revealed that both IFNs substantially modify Legionella-containing vacuoles, and comparative analyses reveal distinct subsets of transcriptionally and spatially IFN-regulated proteins. Immune-responsive gene (IRG)1 is induced by IFNs in mitochondria that closely associate with Legionella-containing vacuoles, and mediates production of itaconic acid. This metabolite is bactericidal against intravacuolar L. pneumophila as well as extracellular multidrug-resistant Gram-positive and -negative bacteria. Our study explores the overall role IFNs play in inducing substantial remodeling of bacterial vacuoles and in stimulating production of IRG1-derived itaconic acid which targets intravacuolar pathogens. IRG1 or its product itaconic acid might be therapeutically targetable to fight intracellular and drug-resistant bacteria.


Conflict of interest statement

The authors have declared that no competing interests exist.

Figures
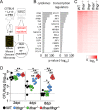
Fig 1
Fig 1. Type I and II IFNs are main regulators of gene expression during L. pneumophila infection.
(A) Workflow for upstream regulator analysis. (B, C) WT (B) or WT, Ifnar -/-, Ifngr -/- and Ifnar/Ifngr -/- mice (C) were infected with L. pneumophila or treated with PBS. Mice were sacrificed 2 d p.i., and microarray analysis performed from lung RNA. Up-regulated genes in L. pneumophila-infected WT mice compared to controls were analyzed for their predicted upstream regulators (B). Heat map of microarray analysis of infected versus PBS-treated mice for wild-type and respective knock-out strains (C). 5 mice per group, pooled for RNA extraction and subsequent analysis. (D) Bacterial loads in the lungs of L. pneumophila infected WT, Ifnar -/-, Ifngr -/- and Ifnar/Ifngr -/- mice are depicted. Data represent mean + s.e.m. of 5–6 mice per group. Dotted line indicates lower detection limit, * p<0.05, ** p<0.01 (Kruskal-Wallis analysis of variance followed by Mann-Whitney U test with Bonferroni correction for multiple comparisons).
Fig 2
Fig 2. Type I and II IFNs restrict L. pneumophila infection through an alveolar macrophage-intrinsic mechanism.
(A) Overview of generation of CD11c-DTR-GFP / Ifnar/Ifngr -/- mixed bone marrow chimeric mice followed by DTX mediated depletion of CD11c-DTR-GFP+ cells. (B) Frequency of remaining CD11c+ GFP+ wild-type cells was correlated to bacterial load in the lungs of CD11c-DTR-GFP / Ifnar/Ifngr -/- + DTX chimeras including all DTX-treated mice (13 mice) at 6 d p.i.. (C) Only mice with <10% GFP+ (of all CD11c+ cells) were considered for analysis and bacterial loads in the lungs of L. pneumophila infected mixed bone marrow-chimeric mice at indicated time points are shown. (D, E) Alveolar macrophages of WT, Ifnar -/-, Ifngr -/- and Ifnar/Ifngr -/- mice were left untreated (E) or were treated with 50 U/ml IFNβ or IFNγ (D) 16–18 h prior to and during infection with L. pneumophila ΔflaA (D) or wt (E). Bacterial growth was determined by CFU counting after 72 h. Data represent 3 independent experiments done in triplicates. * p<0.05, ** p<0.01, *** p<0.001 (Pearson correlation (B), Kruskal-Wallis analysis of variance, Dunn’s multiple comparison (C) or Mann-Whitney U test (D, E)). # No bacteria were detected.
Fig 3
Fig 3. Type I and II IFNs alter the protein composition of LCVs.
(A) Proteomic analysis of LCVs isolated 2 h p.i. from untreated BMMs infected with L. pneumophila ΔflaA detected 2854 proteins in all six replicates of which 2307 were identified as host- and 547 as L. pneumophila-derived. (B) GO enrichment analysis for overrepresented cellular components of the host proteins was done and overrepresented child terms of GO:0043231 ‘intracellular membrane-bounded organelle’ were extracted. Depicted are p-values for the indicated GO terms as well as the number of identified proteins annotated with each term; # no p-value for GO term ‘nucleus’ was computed. (C-E) Quantitative proteomic analysis of LCVs isolated 2 h p.i. with L. pneumophila ΔflaA from BMMs left untreated or treated with 50 U/ml IFNβ or IFNγ 16–18 h prior to and during infection. Volcano plots show unchanged proteins (grey) and proteins with a significant higher (red) or lower (green) abundance at LCVs from IFNβ- (C) or IFNγ- (D) treated BMMs compared to untreated cells, and direct comparison of IFNβ- versus IFNγ-treated samples (E). See also S6 Fig for detailed list of top 20 proteins for each condition. Proteomic analysis was done from 6 (untreated), 5 (IFNγ) and 4 (IFNβ) individual LCV isolations.
Fig 4
Fig 4. Integrated network analysis of IFN-regulated proteins of the LCVs.
Proteins with higher abundance at LCVs from IFNβ- and/or IFNγ-treated compared to untreated cells were analyzed with the STRING database. The proteome data were further compared with the whole genome microarray data (S1 Dataset; genes > 2-fold higher expressed and p < 0.05 in infected WT vs. Ifnar/Ifngr -/- mice) and the INTERFEROME database to indicate molecules which are also transcriptionally regulated by IFNs. A GO enrichment analysis was performed for extracting significant subnetworks of a complex network composed of 335 nodes and 2,612 edges. Shown are subnetworks positively affected by IFNβ and/or IFNγ activation such as ‘immune response’, ‘antigen processing and presentation’ and the ‘proteasome complex’.
Fig 5
Fig 5. RNAi screen identifies IRG1 as crucial L. pneumophila restricting factor.
(A, B) BMMs were transfected with control siRNA or a pool of two siRNAs per gene 24 h prior to infection and infected with L. pneumophila. Expression of targeted genes was assessed 24 h p.i. by qRT-PCR (A), and CFUs were counted 72 h p.i. (B). Data are mean + s.e.m. of 2 (A) or 4 (B) independent experiments done in triplicates. * p<0.05, ** p<0.01, *** p<0.001, no indication if not significant (Mann-Whitney U test).
Fig 6
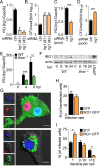
Fig 6. IRG1 is regulated by IFNs and restricts L. pneumophila within their vacuoles.
(A-D) BMMs (A, B) or alveolar macrophages (C, D) were transfected with control or two IRG1 siRNAs separately (A, B) or pooled (C, D), infected with L. pneumophila, Irg1 expression was assessed 24 h p.i. (A, C), and CFUs were counted 72 h p.i. (B, D). (E, F) Irg1 gene and IRG1 protein expression in WT and Ifnar -/- BMMs upon infection with L. pneumophila was determined at indicated time points by qRT-PCR (E) and western blot (F). Cells overexpressing IRG1-Myc-DDK (pIRG1) were loaded as a positive control (F). (G-I) Ifnar -/- BMMs overexpressing IRG1-GFP or GFP only were infected with DsRed-expressing L. pneumophila (red). Cells were fixed 24 h p.i., representative images taken (G), and overall infection rate (H) as well as number of intracellular bacteria per cell determined by manual counting (I). (G) Scale bars indicate 5 μm. Data are mean + s.e.m. of 2 (A, B) or 4 (E) independent experiments done in triplicates or 3 independent experiments done in quadruplicates (C, D). * p<0.05, ** p<0.01, *** p<0.001, no indication if not significant (Mann-Whitney U test). (F) Representative blot of 3 independent experiments. (H, I) > 100 GFP- / IRG1-GFP-expressing cells were counted manually for intracellular bacterial numbers, data represent mean + s.e.m. of 2 independent experiments done in duplicates * p<0.05, no indication if not significant (Mann-Whitney U test).
Fig 7
Fig 7. Mitochondrial IRG1 closely associates with LCVs.
(A, B) Ifnar -/- BMMs overexpressing IRG1-GFP (green) were stained with mitotracker (red), fixed and nuclei were visualized by DAPI (blue) staining. Images represent maximum intensity projections of z-stacks of 10 individual 1.4 μm thick sections. (B) Fluorescence intensity profiles of IRG1-GFP and mitotracker along the dotted line in (A) are depicted. (C) Super-resolution fluorescent image generated by structured illumination microscopy of BMMs stained with mitotracker (red) and subsequently infected with L. pneumophila for 2 h. Bacteria and LCVs were visualized in fixed cells by L. pneumophila (green) and SidC (LCV-located L. pneumophila-protein; cyan) staining, respectively. Large overview image represents maximum intensity projection of a z-stack of 30 individual 0.126 μm thick sections. Enlarged sections in the left panel depict one single confocal plane for each selected LCV according to numbers in the overview image. White arrowheads point towards close associations of mitochondria with the LCV membrane. (D) Ifnar -/- BMMs overexpressing IRG1-GFP were infected with DsRed-expressing L. pneumophila wt (red). 2 h p.i. cells were homogenized and LCVs and nuclei were visualized by SidC (LCV-located L. pneumophila-protein; cyan) and DAPI (blue) staining. Framed area from the upper left overview image is shown as orthogonal view of a z-stack of 8 individual 0.68 μm thick sections and as single channels for depicted section. (A, C, D) Scale bars indicate 5 μm.
Fig 8
Fig 8. IRG1 mediates production of itaconic acid, which is bactericidal against L. pneumophila as well as multidrug-resistant Gram-positive and -negative bacteria.
(A-C) Intracellular levels of itaconic acid were measured by GC-MS in BMMs after stimulation with 50 U/ml IFNβ or IFNγ for 16–18 h (A), infection with L. pneumophila for 24 h (B), and in BMMs transfected with siRNAs 24 h prior infection and infected with L. pneumophila for 24 h (C). (D, E) Irg1 expression (D) and itaconic acid levels (E) in lungs of L. pneumophila-infected or control mice measured by qRT-PCR or GC-MS, respectively, 2 d p.i.. (F) Itaconic acid was added to L. pneumophila in liquid culture and bacterial growth was assessed. (G-J) L. pneumophila, S. aureus (MRSA) and A. baumannii (MDR) were incubated in PBS containing itaconic acid or related acids, and numbers of viable bacteria were determined by CFU counting. (A-C) Data represent mean + s.e.m. of 3 (A) or 4 (B, C) experiments, done in sextuplicates pooled for GC-MS analysis. (D, E) Data represent mean + s.e.m. of 4 (E) or 5 (D) mice per group. (F) Representative graph of 3 independent experiments. (E, F) Data represent mean + s.e.m. of 2 (G) or 3 (H-J) experiments done in triplicates. # No viable bacteria were detected.
Fig 9
Fig 9. Overview of the type I and II IFN-driven, alveolar macrophage-intrinsic defense pathway that restricts L. pneumophila during lung infection (as discussed in the text).

Similar articles

Cited by

References

    1. Kumar Y, Valdivia RH (2009) Leading a sheltered life: intracellular pathogens and maintenance of vacuolar compartments. Cell Host Microbe 5: 593–601. 10.1016/j.chom.2009.05.014 - DOI - PMC - PubMed
    1. MacMicking JD (2012) Interferon-inducible effector mechanisms in cell-autonomous immunity. Nat Rev Immunol 12: 367–382. 10.1038/nri3210 - DOI - PMC - PubMed
    1. Randow F, MacMicking JD, James LC (2013) Cellular self-defense: how cell-autonomous immunity protects against pathogens. Science 340: 701–706. 10.1126/science.1233028 - DOI - PMC - PubMed
    1. Hertzog P, Forster S, Samarajiwa S (2011) Systems biology of interferon responses. J Interferon Cytokine Res 31: 5–11. 10.1089/jir.2010.0126 - DOI - PubMed
    1. Isberg RR O'Connor TJ, Heidtman M (2009) The Legionella pneumophila replication vacuole: making a cosy niche inside host cells. Nat Rev Microbiol 7: 13–24. 10.1038/nrmicro1967 - DOI - PMC - PubMed

Publication types

MeSH terms

LinkOut - more resources