

Accurately Achieving Target Busulfan Exposure in Children and Adolescents With Very Limited Sampling and the BestDose Software
- PMID: 26829600
- PMCID: PMC4864122
- DOI: 10.1097/FTD.0000000000000276
Accurately Achieving Target Busulfan Exposure in Children and Adolescents With Very Limited Sampling and the BestDose Software
Abstract
Background: Busulfan dose adjustment is routinely guided by plasma concentration monitoring using 4-9 blood samples per dose adjustment, but a pharmacometric Bayesian approach could reduce this sample burden.
Methods: The authors developed a nonparametric population model with Pmetrics. They used it to simulate optimal initial busulfan dosages, and in a blinded manner, they compared dosage adjustments using the model in the BestDose software to dosage adjustments calculated by noncompartmental estimation of area under the time-concentration curve at a national reference laboratory in a cohort of patients not included in model building.
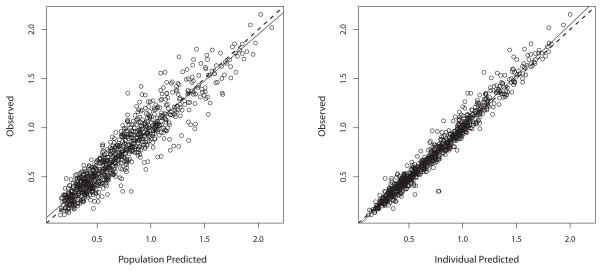
Results: Mean (range) age of the 53 model-building subjects was 7.8 years (0.2-19.0 years) and weight was 26.5 kg (5.6-78.0 kg), similar to nearly 120 validation subjects. There were 16.7 samples (6-26 samples) per subject to build the model. The BestDose cohort was also diverse: 10.2 years (0.25-18 years) and 46.4 kg (5.2-110.9 kg). Mean bias and imprecision of the 1-compartment model-predicted busulfan concentrations were 0.42% and 9.2%, and were similar in the validation cohorts. Initial dosages to achieve average concentrations of 600-900 ng/mL were 1.1 mg/kg (≤12 kg, 67% in the target range) and 1.0 mg/kg (>12 kg, 76% in the target range). Using all 9 concentrations after dose 1 in the Bayesian estimation of dose requirements, the mean (95% confidence interval) bias of BestDose calculations for the third dose was 0.2% (-2.4% to 2.9%, P = 0.85), compared with the standard noncompartmental method based on 9 concentrations. With 1 optimally timed concentration 15 minutes after the infusion (calculated with the authors' novel MMopt algorithm) bias was -9.2% (-16.7% to -1.5%, P = 0.02). With 2 concentrations at 15 minutes and 4 hours bias was only 1.9% (-0.3% to 4.2%, P = 0.08).
Conclusions: BestDose accurately calculates busulfan intravenous dosage requirements to achieve target plasma exposures in children up to 18 years of age and 110 kg using only 2 blood samples per adjustment compared with 6-9 samples for standard noncompartmental dose calculations.
Conflict of interest statement
None.
Figures
Similar articles
-
Evaluation of two software using Bayesian methods for monitoring exposure and dosing once-daily intravenous busulfan in paediatric patients receiving haematopoietic stem cell transplantation.Cancer Chemother Pharmacol. 2021 Sep;88(3):379-391. doi: 10.1007/s00280-021-04288-0. Epub 2021 May 22. Cancer Chemother Pharmacol. 2021. PMID: 34021809
-
Thirteen years' experience of pharmacokinetic monitoring and dosing of busulfan: can the strategy be improved?Ther Drug Monit. 2014 Feb;36(1):86-92. doi: 10.1097/FTD.0b013e31829dc940. Ther Drug Monit. 2014. PMID: 24299921
-
Development of a population pharmacokinetics-based sampling schedule to target daily intravenous busulfan for outpatient clinic administration.J Clin Pharmacol. 2010 Nov;50(11):1292-300. doi: 10.1177/0091270009357430. Epub 2010 Jan 14. J Clin Pharmacol. 2010. PMID: 20075185
-
[High-dose busulfan--monitoring plasma levels and dosage adjustments in adults].Cas Lek Cesk. 2001 Nov 22;140(23):724-8. Cas Lek Cesk. 2001. PMID: 11787234 Review. Czech.
-
Therapeutic drug monitoring of busulfan in transplantation.Curr Pharm Des. 2008;14(20):1936-49. doi: 10.2174/138161208785061382. Curr Pharm Des. 2008. PMID: 18691105 Review.
Cited by
-
Optimising antimicrobial therapy through the use of Bayesian dosing programs.Int J Clin Pharm. 2019 Oct;41(5):1121-1130. doi: 10.1007/s11096-019-00886-4. Epub 2019 Aug 7. Int J Clin Pharm. 2019. PMID: 31392582 Review.
-
Evaluation of two software using Bayesian methods for monitoring exposure and dosing once-daily intravenous busulfan in paediatric patients receiving haematopoietic stem cell transplantation.Cancer Chemother Pharmacol. 2021 Sep;88(3):379-391. doi: 10.1007/s00280-021-04288-0. Epub 2021 May 22. Cancer Chemother Pharmacol. 2021. PMID: 34021809
-
Evaluation of the MeroRisk Calculator, A User-Friendly Tool to Predict the Risk of Meropenem Target Non-Attainment in Critically Ill Patients.Antibiotics (Basel). 2021 Apr 20;10(4):468. doi: 10.3390/antibiotics10040468. Antibiotics (Basel). 2021. PMID: 33924047 Free PMC article.
-
Implementation and Cross-Validation of a Pharmacokinetic Model for Precision Dosing of Busulfan in Hematopoietic Stem Cell Transplanted Children.Pharmaceutics. 2022 Oct 1;14(10):2107. doi: 10.3390/pharmaceutics14102107. Pharmaceutics. 2022. PMID: 36297541 Free PMC article.
-
The Significance of Bayesian Pharmacokinetics in Dosing for Critically Ill Patients: A Primer for Clinicians Using Vancomycin as an Example.Antibiotics (Basel). 2023 Sep 13;12(9):1441. doi: 10.3390/antibiotics12091441. Antibiotics (Basel). 2023. PMID: 37760737 Free PMC article. Review.
References
-
- Vassal G, Michel G, Espérou H, Gentet JC, Valteau-Couanet D, Doz F, et al. Prospective validation of a novel IV busulfan fixed dosing for paediatric patients to improve therapeutic AUC targeting without drug monitoring. Cancer Chemother Pharmacol. 2008 Jan;61(1):113–23. - PubMed
-
- Schechter T, Finkelstein Y, Doyle J, Verjee Z, Moretti M, Koren G, et al. Pharmacokinetic disposition and clinical outcomes in infants and children receiving intravenous busulfan for allogeneic hematopoietic stem cell transplantation. Biol Blood Marrow Transplant. 2007 Mar;13(3):307–14. - PubMed
-
- Nguyen L, Fuller D, Lennon S, Leger F. IV busulfan in pediatrics: a novel dosing to improve safety/efficacy for hematopoietic progenitor cell transplantation recipients. Bone Marrow Transplant. 2004 May;33(10):979–87. - PubMed
-
- Dix SP, Wingard JR, Mullins RE, Jerkunica I, Davidson TG, Gilmore CE, et al. Association of busulfan area under the curve with veno-occlusive disease following BMT. Bone Marrow Transplant. 1996 Feb;17(2):225–30. - PubMed
Publication types
MeSH terms
Substances
Grants and funding
LinkOut - more resources
Full Text Sources
Other Literature Sources
