. 2016 Feb 1;11(2):e0148047.
doi: 10.1371/journal.pone.0148047. eCollection 2016.

Development of an Analysis Pipeline Characterizing Multiple Hypervariable Regions of 16S rRNA Using Mock Samples

Affiliations

Development of an Analysis Pipeline Characterizing Multiple Hypervariable Regions of 16S rRNA Using Mock Samples

Jennifer J Barb et al. PLoS One. .

Abstract

Objectives: There is much speculation on which hypervariable region provides the highest bacterial specificity in 16S rRNA sequencing. The optimum solution to prevent bias and to obtain a comprehensive view of complex bacterial communities would be to sequence the entire 16S rRNA gene; however, this is not possible with second generation standard library design and short-read next-generation sequencing technology.

Methods: This paper examines a new process using seven hypervariable or V regions of the 16S rRNA (six amplicons: V2, V3, V4, V6-7, V8, and V9) processed simultaneously on the Ion Torrent Personal Genome Machine (Life Technologies, Grand Island, NY). Four mock samples were amplified using the 16S Ion Metagenomics Kit™ (Life Technologies) and their sequencing data is subjected to a novel analytical pipeline.

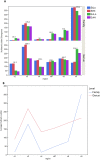
Results: Results are presented at family and genus level. The Kullback-Leibler divergence (DKL), a measure of the departure of the computed from the nominal bacterial distribution in the mock samples, was used to infer which region performed best at the family and genus levels. Three different hypervariable regions, V2, V4, and V6-7, produced the lowest divergence compared to the known mock sample. The V9 region gave the highest (worst) average DKL while the V4 gave the lowest (best) average DKL. In addition to having a high DKL, the V9 region in both the forward and reverse directions performed the worst finding only 17% and 53% of the known family level and 12% and 47% of the genus level bacteria, while results from the forward and reverse V4 region identified all 17 family level bacteria.

Conclusions: The results of our analysis have shown that our sequencing methods using 6 hypervariable regions of the 16S rRNA and subsequent analysis is valid. This method also allowed for the assessment of how well each of the variable regions might perform simultaneously. Our findings will provide the basis for future work intended to assess microbial abundance at different time points throughout a clinical protocol.


Conflict of interest statement

Competing Interests: This manuscript is not an endorsement of any Life Technology products. The company had no input in the writing of this manuscript. The authors of this manuscript neither received any support from nor accepted any funds from Life Technologies, Inc., a Thermo Fisher Scientific Brand, Grand Island, New York. This work was completed as part of the authors’ official duties as employees of the National Institutes of Health (NIH). The opinions expressed are the authors’ own. They do not represent the position or policy of the U.S. NIH, Public Health Service, or Department of Health and Human Services.

Figures

Fig 1
Fig 1. Schematic of 16S rRNA gene and primer targets.
Schematic of 16s gene and location of two primer sets from the Ion 16S Metagenomics Kit *. This kit is composed of two sets of primers in separate tubes targeting seven hypervariable regions along the 16s gene. Primer sets in tube one, represented by blue arrows, shows locations of primers for V2, V4, and V8. Primer sets in tube two, represented by green arrows, shows locations of primer for V3, V6-7 and V9. Sequencing using the Ion Torrent machine is bidirectional, not paired primers. One primer targets two regions, V6 and V7. (* Image is owned by Life Technologies Corporation, www.lifetechnologies.com, copied from https://www.lifetechnologies.com/content/dam/LifeTech/Documents/PDFs/Ion-16S-Metagenomics-Kit-Software-Application-Note.pdf © 2015 Thermo Fisher Scientific, Inc. Used with permission.)
Fig 2
Fig 2. Data Processing Pipeline.
Workflow of data processing pipeline using Ion 16S Metagenomics Kit. Step 1, Pre-processing of the data consists of quality filtering, read ID editing and concatenating reads into one file. Step 2, creating subsets of reads into appropriate targeted variable regions consists first of using Mothur to align the reads, then separating reads into forward and reverse based on their alignment into 16S gene coordinates. This last step allows reads to be binned into their appropriate targeted region. Step 3, uses a mixture of QIIME and UPARSE for OTU clustering and taxonomy assignment. Step 4, discusses future directions in order to come up with a consensus table taking into account bacteria found from each variable region and computing α and β diversity.
Fig 3
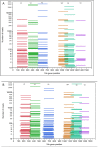
Fig 3. Aligned Reads by Region.
Coverage of aligned forward (A) and reverse (B) reads. X-axis shows the position along the 16S rRNA gene using Streptococcus mutans (GenBank accession DQ677761) as the reference and the y-axis shows the number of reads giving the same start and stop position. Colors of the lines indicate which variable region the read was assigned to given the aligned coordinates. Colors correspond to reads assigned to 1 of 6 subsets of reads for OTU picking; V2 (red), V3 (green), V4 (blue), V6-7 (orange) and V8 (blue-green) and V9 (purple).
Fig 4
Fig 4. Incidence map showing bacteria found at family and genus level.
Incidence map showing whether bacteria was found in the forward reads at both the family and genus (red), at the family only (blue) or not found at family or genus level (black X) for each of the 6 regions.
Fig 5
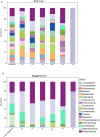
Fig 5. Family Level Bacterial Abundance.
Bacterial abundance for known mock samples and 6 other variable regions of forward reads. (A) Genus Level Known Even vs. Even Low mock samples, (B) Genus Level Known Staggered vs. Staggered Low mock samples. (Figs A and B in S2 Fig show Even High and Staggered High samples for genus level)
Fig 6
Fig 6. Average Shannon Diversity Difference from known at the Family and Genus level.
Average difference between the known Shannon Diversity index vs that calculated for each region at both the family and genus level. Y-axis shows the hypervariable region. X-axis shows the Family (left) and Genus (right) average difference values. Red bars show the average difference in the forward read analysis and the blue bars show the average difference in the reverse read analysis.
Fig 7
Fig 7. Kullback-Leibler Divergence.
(A) Bar graph showing family (upper) and genus (lower) level Kullback-Leibler divergence (y-axis) for 6 regions (x-axis). Known mock compared to observed mock (EvHi, purple; EvLo green; StHi red; StLo blue) for forward reads. The average DKL over all mock samples for each region is shown above the bar charts for a particular region. (B) Average Dkl over 4 mock samples at each region for both family (blue) and genus (red).

References

    1. Woese CR. Bacterial evolution. Microbiol Rev. 1987;51(2):221–271. - PMC - PubMed
    1. Lane DJ, Pace B, Olsen GJ, Stahl DA, Sogin ML, Pace NR. Rapid determination of 16S ribosomal RNA sequences for phylogenetic analyses. Proc Natl Acad Sci U S A. 1985;82(20):6955–6959. - PMC - PubMed
    1. Clarridge JE 3rd. Impact of 16S rRNA gene sequence analysis for identification of bacteria on clinical microbiology and infectious diseases. Clin Microbiol Rev. 2004;17(4):840–862. - PMC - PubMed
    1. Sanger F, Coulson AR. A rapid method for determining sequences in DNA by primed synthesis with DNA polymerase. J Mol Biol. 1975;94(3):441–448. - PubMed
    1. Salipante SJ, Kawashima T, Rosenthal C, Hoogestraat DR, Cummings LA. Sengupta DJ,et al. Performance comparison of Illumina and ion torrent next-generation sequencing platforms for 16S rRNA-based bacterial community profiling. Appl Environ Microbiol. 2014;80(24):7583–7591. 10.1128/AEM.02206-14 - DOI - PMC - PubMed

Publication types

Substances