. 2016 Mar;48(3):308-313.
doi: 10.1038/ng.3501. Epub 2016 Feb 1.

Uncovering Listeria monocytogenes hypervirulence by harnessing its biodiversity

Affiliations

Uncovering Listeria monocytogenes hypervirulence by harnessing its biodiversity

Mylène M Maury et al. Nat Genet. 2016 Mar.

Erratum in

Abstract

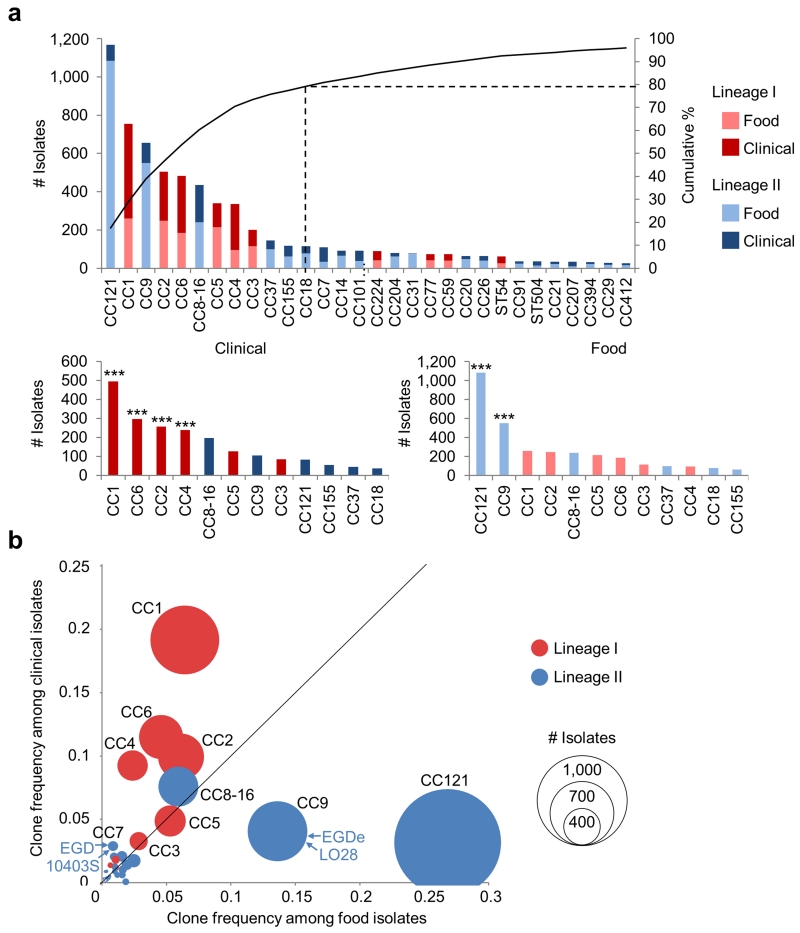
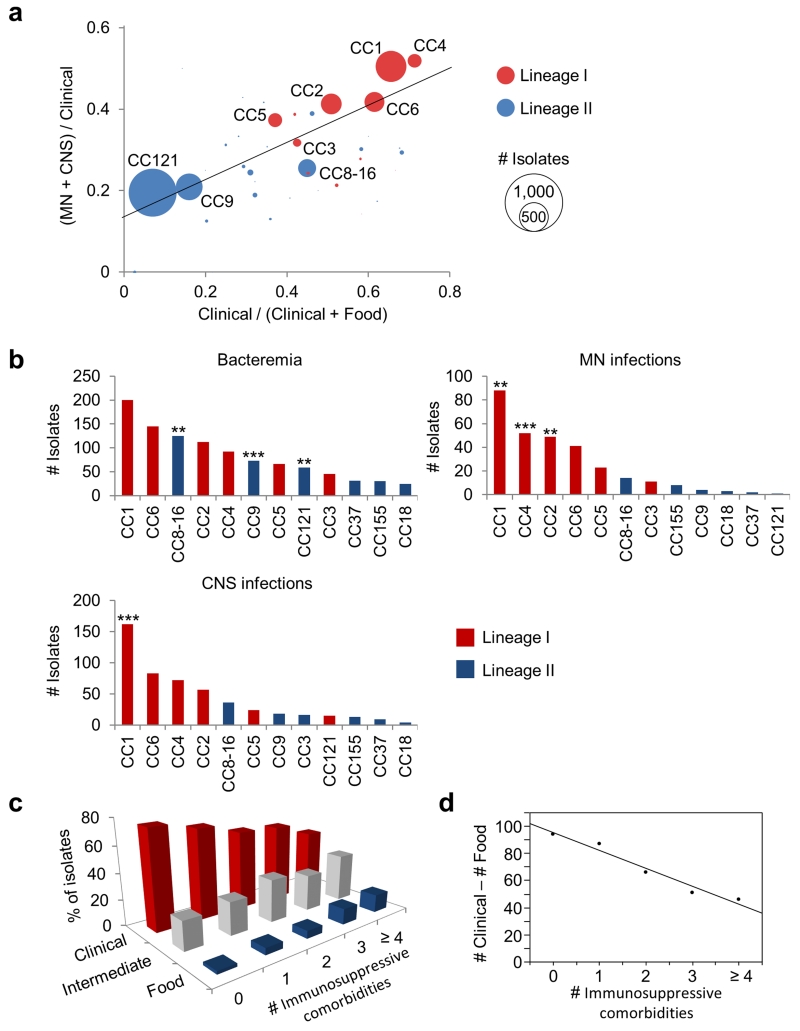
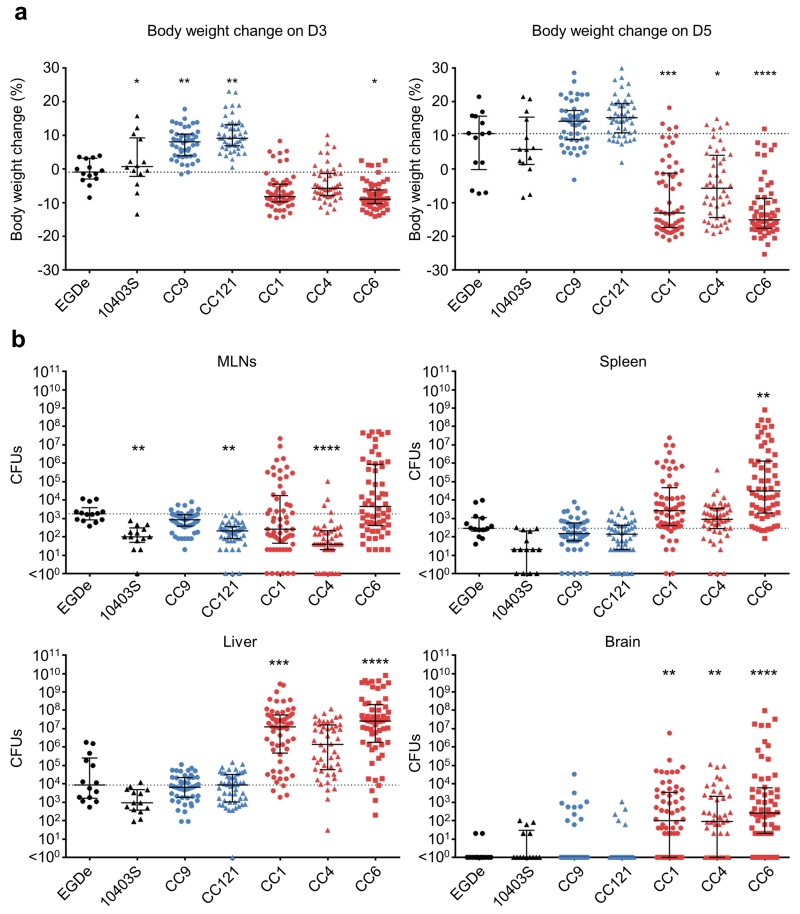
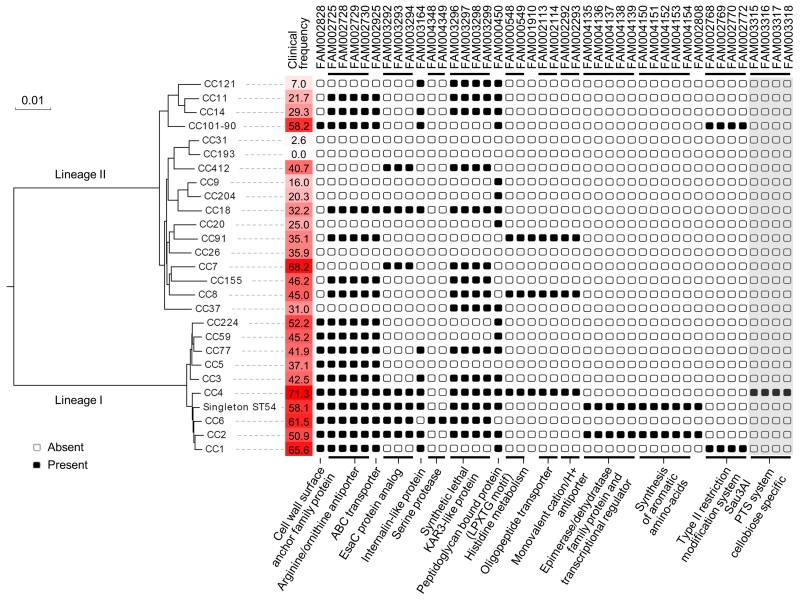
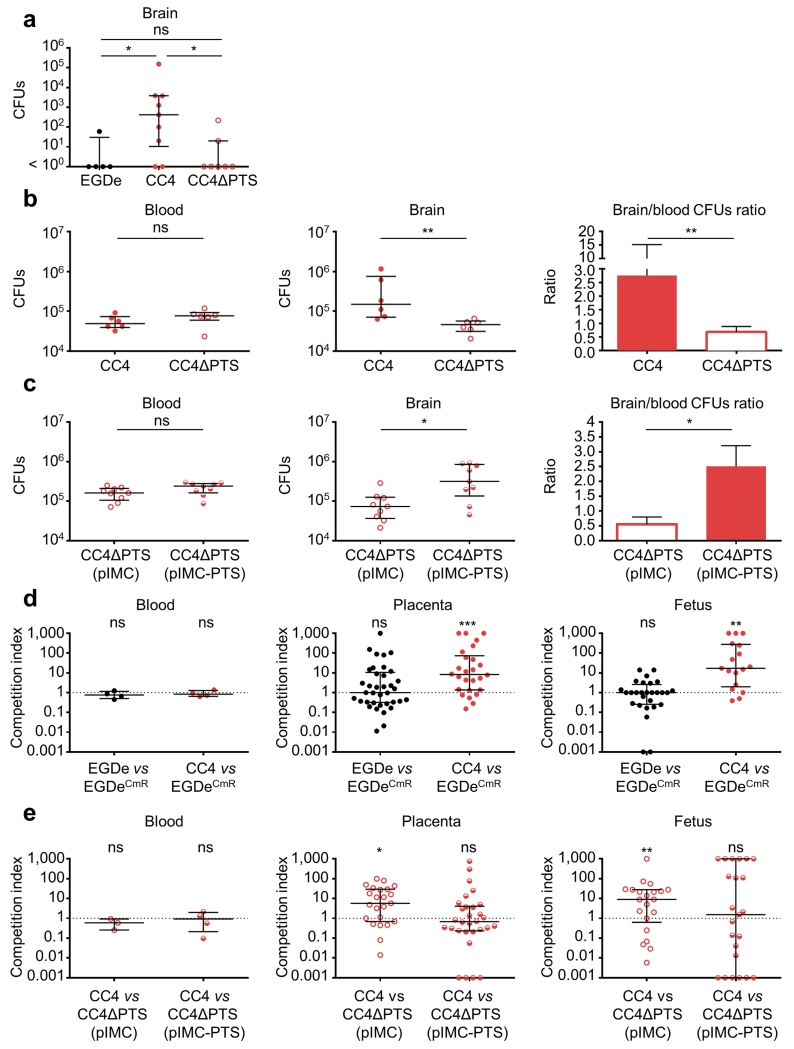
Microbial pathogenesis studies are typically performed with reference strains, thereby overlooking within-species heterogeneity in microbial virulence. Here we integrated human epidemiological and clinical data with bacterial population genomics to harness the biodiversity of the model foodborne pathogen Listeria monocytogenes and decipher the basis of its neural and placental tropisms. Taking advantage of the clonal structure of this bacterial species, we identify clones epidemiologically associated either with food or with human central nervous system (CNS) or maternal-neonatal (MN) listeriosis. The latter clones are also most prevalent in patients without immunosuppressive comorbidities. Strikingly, CNS- and MN-associated clones are hypervirulent in a humanized mouse model of listeriosis. By integrating epidemiological data and comparative genomics, we have uncovered multiple new putative virulence factors and demonstrate experimentally the contribution of the first gene cluster mediating L. monocytogenes neural and placental tropisms. This study illustrates the exceptional power in harnessing microbial biodiversity to identify clinically relevant microbial virulence attributes.


Figures

Figure 1
Figure 1. Prevalence and distribution of MLST clones in food and clinical sources
The analysis is based on 6,633 food and clinical isolates collected between 2005 and 2013. (a, top), Unequal prevalence of Lm MLST clones. The curve represents the cumulative percentage of isolates pertaining to clones, ordered by total number of isolates. Only clones with more than 10 isolates are shown. (a, bottom), Distribution of clones in food and clinical sources, ranked by number of isolates of each origin. The 12 major clones that represented 79.2% of all isolates are shown. Association to food or clinical origins (Chi2 tests): *, p < 0.01; **, p < 0.001; ***, p < 0.0001 (see Supplementary Table 1). (b) Frequencies of clones with > 10 isolates among food (x axis) and clinical (y axis) isolates. Circle size is proportional to the numbers of isolates. Positions of reference strains are shown.
Figure 2
Figure 2. Infectious potential of MLST clones
(a) Frequency of clones in CNS (Central Nervous System) and MN (Materno-Neonatal) infections as a function of clinical frequency. Linear regression was weighted based on number of isolates per clone: R2 = 0.62; p < 1.10−10. All clones with more than five isolates were included. (b) Distribution of the major clones in bacteremia (above, left), CNS (below) and MN (above, right). Absolute numbers of isolates per clone involved in each category of infection are shown. The 12 major clones were ranked by absolute number of isolates (Supplementary Table 2). Association to bacteremia, CNS and MN infections (Chi2 test): *, p < 0.01; **, p < 0.001; ***, p < 0.0001. (c) The histograms show the distribution of food-associated (food, CC9 and CC121, blue), infection-associated (clinical, CC1, CC2, CC4, and CC6, red) and intermediate clones (intermediate, CC8-16, CC5, CC3, CC37, CC155 and CC18, grey) in patient groups with 0, 1, 2, 3, and 4 or more immunosuppressive comorbidities. (d) Linear regression (R2 = 0.96; p = 0.0032) of the difference between the numbers of isolates belonging to infection-associated clones (#Clinical) and those belonging to food-associated clones (#Food) (y axis), against the number of immunosuppressive comorbidities of infected patients (# Immunosuppressive comorbidities, x axis).
Figure 3
Figure 3. Compared virulence of the six major clonal complexes
(a) Mouse body weight loss on day 3 and day 5 post infection. (b), Bacterial loads on day 5 post infection are shown as total colony forming units (CFUs) recovered from the entire organs. Humanized mice were orally inoculated with 2.108 CFUs. Results are shown as median ± interquartile range. The dotted line indicates the median value of EGDe infected mice. Two isolates from each origin: food, bacteremia, maternal-neonatal (MN) infection, and CNS infection were selected in each clone, except for CC1 and CC6, in which there are 4 human CNS isolates and 2 isolates in each other origin (food, bacteremia and MN infections). For CC121, there are 2 isolates from food, 2 from bacteremia, 1 from MN and 3 from CNS infection. Number of mice: n = 14 for EGDe and 10403S; n = 48 for CC9, CC121 and CC4; n = 60 for CC1 and CC6. Clinical-associated clones are represented in red, food-associated clones in blue and reference strains (EGDe and 10403S) in black. Dunn’s multiple comparison test relative to EGDe infected mice: *, p < 0.05; **, p < 0.01; ***, p < 0.001; ****, p < 0.0001. The difference compared to EGDe infected mice was non-significant unless indicated. MLNs, mesenteric lymph nodes.
Figure 4
Figure 4. Phylogenetic distribution of novel putative virulence factors identified in this study
Genes that were highly associated with high clinical frequency of clones (see GEE analysis in Online methods), and had an identified putative function are shown. The recombination-purged phylogeny within each lineage was based on its respective core genome. Percentages of clinical isolates in each clone are highlighted by a red gradient. Gene families are named as in Supplementary Table 9. Groups of syntenic genes are indicated by black horizontal lines. Putative functions or pathways are indicated below. Only the four LIPI-4 genes with no parologs in other genomes are shown (highlighted in grey).
Figure 5
Figure 5. Implication of hypervirulent clone CC4-associated PTS (LIPI-4) in CNS and placental infection
Humanized mice were inoculated orally (dose 3.108) (a) or intravenously (dose 5.105) (b) with strain EGDe (n = 5 in a), CC4 strain LM09-00558 (CC4, n = 9 in a, n = 6 in b) or whole PTS cluster deletion mutant derived from LM09-00558 (CC4ΔPTS, n = 7 in a, n = 6 in b). (c) Humanized mice were intravenously infected (dose 5.105) by CC4ΔPTS containing either a single copy of pIMC (n = 9) or pIMC with PTS cluster under its native promoter (n = 9). (d) Competition index of WT EGDe (n = 4) or WT CC4 (n = 4) was tested against chloramphenicol-resistant EGDe (containing pIMC) in pregnant humanized mice. (e) Competition index of WT CC4 was tested against chloramphenicol-resistant CC4ΔPTS (pIMC) (n = 3) or CC4ΔPTS (pIMC-PTS) (n = 4) in pregnant humanized mice. Pregnant mice at day 14/21 of gestation were intravenously infected with a 1:1 mixture of the two strains as indicated (total dose 2.105). Mice were sacrificed on day 5 post infection for orally inoculated bacteria (a), or day 2 post infection when intravenously inoculated (b-e). Results are shown as median ± interquartile range. Each dot represents an organ (a-c) or blood (a-e) from one infected mouse, or one placenta or fetus (d and e). Statistical analyses were done by a Dunn’s multiple comparison test (a), Mann–Whitney U test (b and c), or Wilcoxon matched-pairs signed-rank test (d and e): *, p < 0.05; **, p < 0.01; ***, p < 0.001.

Comment in

References

    1. Falkow S, Isberg RR, Portnoy DA. The interaction of bacteria with mammalian cells. Annu Rev Cell Biol. 1992;8:333–363. - PubMed
    1. Cossart P, Boquet P, Normark S, Rappuoli R. Cellular microbiology emerging. Science. 1996;271:315–316. - PubMed
    1. Welch RA, et al. Extensive mosaic structure revealed by the complete genome sequence of uropathogenic Escherichia coli. Proc Natl Acad Sci U S A. 2002;99:17020–17024. - PMC - PubMed
    1. Holden MT, et al. Complete genomes of two clinical Staphylococcus aureus strains: evidence for the rapid evolution of virulence and drug resistance. Proc Natl Acad Sci U S A. 2004;101:9786–9791. - PMC - PubMed
    1. Hensel M, et al. Simultaneous identification of bacterial virulence genes by negative selection. Science. 1995;269:400–403. - PubMed

References for online methods

    1. Cantinelli T, et al. “Epidemic clones” of Listeria monocytogenes are widespread and ancient clonal groups. J Clin Microbiol. 2013;51:3770–3779. - PMC - PubMed
    1. Holm S. A Simple Sequentially Rejective Multiple Test Procedure. Scand J Statist. 1979;6:65–70.
    1. Bonferroni CE. Teoria statistica delle classi e calcolo delle probabilità. Pubblicazioni del R Istituto Superiore di Scienze Economiche e Commerciali di Firenze. 1936;8:3–62.
    1. Disson O, et al. Modeling human listeriosis in natural and genetically engineered animals. Nat Protoc. 2009;4:799–810. - PubMed
    1. Criscuolo A, Brisse S. AlienTrimmer: a tool to quickly and accurately trim off multiple short contaminant sequences from high-throughput sequencing reads. Genomics. 2013;102:500–506. - PubMed

Publication types