Iterative Covariance-Based Removal of Time-Synchronous Artifacts: Application to Gastrointestinal Electrical Recordings
- PMID: 26829772
- PMCID: PMC5094763
- DOI: 10.1109/TBME.2016.2521764
Iterative Covariance-Based Removal of Time-Synchronous Artifacts: Application to Gastrointestinal Electrical Recordings
Abstract
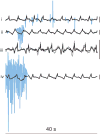
Objective: The aim of this study was to develop, validate, and apply a fully automated method for reducing large temporally synchronous artifacts present in electrical recordings made from the gastrointestinal (GI) serosa, which are problematic for properly assessing slow wave dynamics. Such artifacts routinely arise in experimental and clinical settings from motion, switching behavior of medical instruments, or electrode array manipulation.
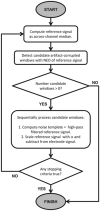
Methods: A novel iterative Covariance-Based Reduction of Artifacts (COBRA) algorithm sequentially reduced artifact waveforms using an updating across-channel median as a noise template, scaled and subtracted from each channel based on their covariance.
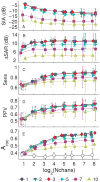
Results: Application of COBRA substantially increased the signal-to-artifact ratio (12.8 ± 2.5 dB), while minimally attenuating the energy of the underlying source signal by 7.9% on average ( -11.1 ± 3.9 dB).
Conclusion: COBRA was shown to be highly effective for aiding recovery and accurate marking of slow wave events (sensitivity = 0.90 ± 0.04; positive-predictive value = 0.74 ± 0.08) from large segments of in vivo porcine GI electrical mapping data that would otherwise be lost due to a broad range of contaminating artifact waveforms.
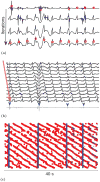
Significance: Strongly reducing artifacts with COBRA ultimately allowed for rapid production of accurate isochronal activation maps detailing the dynamics of slow wave propagation in the porcine intestine. Such mapping studies can help characterize differences between normal and dysrhythmic events, which have been associated with GI abnormalities, such as intestinal ischemia and gastroparesis. The COBRA method may be generally applicable for removing temporally synchronous artifacts in other biosignal processing domains.
Figures

Similar articles
-
High-resolution electrical mapping of porcine gastric slow-wave propagation from the mucosal surface.Neurogastroenterol Motil. 2017 May;29(5):10.1111/nmo.13010. doi: 10.1111/nmo.13010. Epub 2016 Dec 29. Neurogastroenterol Motil. 2017. PMID: 28035728 Free PMC article.
-
Suppression of ventilation artifacts for gastrointestinal slow wave recordings.Annu Int Conf IEEE Eng Med Biol Soc. 2017 Jul;2017:2769-2772. doi: 10.1109/EMBC.2017.8037431. Annu Int Conf IEEE Eng Med Biol Soc. 2017. PMID: 29060472
-
Sparse time artifact removal.J Neurosci Methods. 2016 Mar 15;262:14-20. doi: 10.1016/j.jneumeth.2016.01.005. Epub 2016 Jan 8. J Neurosci Methods. 2016. PMID: 26778608
-
A review of the performance of artifact filtering algorithms for cardiopulmonary resuscitation.J Healthc Eng. 2013;4(2):185-202. doi: 10.1260/2040-2295.4.2.185. J Healthc Eng. 2013. PMID: 23778011 Review.
-
Gastrointestinal extracellular electrical recordings: fact or artifact?Neurogastroenterol Motil. 2012 Jan;24(1):1-6. doi: 10.1111/j.1365-2982.2011.01815.x. Neurogastroenterol Motil. 2012. PMID: 22188324 Free PMC article. Review.
Cited by
-
Comparison of Dry and Wet Electrodes for Detecting Gastrointestinal Activity Patterns from Body Surface Electrical Recordings.Ann Biomed Eng. 2023 Jun;51(6):1310-1321. doi: 10.1007/s10439-023-03137-w. Epub 2023 Jan 19. Ann Biomed Eng. 2023. PMID: 36656453
-
Adaptive Artifact Removal From Intracortical Channels for Accurate Decoding of a Force Signal in Freely Moving Rats.Front Neurosci. 2019 Apr 16;13:350. doi: 10.3389/fnins.2019.00350. eCollection 2019. Front Neurosci. 2019. PMID: 31040764 Free PMC article.
-
High-resolution electrical mapping of porcine gastric slow-wave propagation from the mucosal surface.Neurogastroenterol Motil. 2017 May;29(5):10.1111/nmo.13010. doi: 10.1111/nmo.13010. Epub 2016 Dec 29. Neurogastroenterol Motil. 2017. PMID: 28035728 Free PMC article.
References
-
- Lammers WJ, et al. Origin and propagation of the slow wave in the canine stomach: the outlines of a gastric conduction system. American Journal of Physiology-Gastrointestinal and Liver Physiology. 2009;296(6):G1200–G1210. - PubMed
Publication types
MeSH terms
Grants and funding
LinkOut - more resources
Full Text Sources
Other Literature Sources
Miscellaneous

