

Simulations of a Vibrissa Slipping along a Straight Edge and an Analysis of Frictional Effects during Whisking
- PMID: 26829805
- PMCID: PMC5753595
- DOI: 10.1109/TOH.2016.2522432
Simulations of a Vibrissa Slipping along a Straight Edge and an Analysis of Frictional Effects during Whisking
Abstract
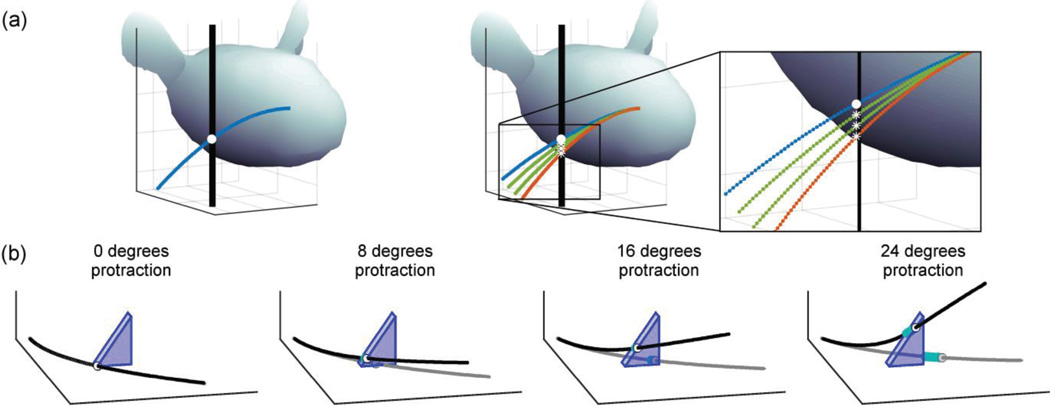
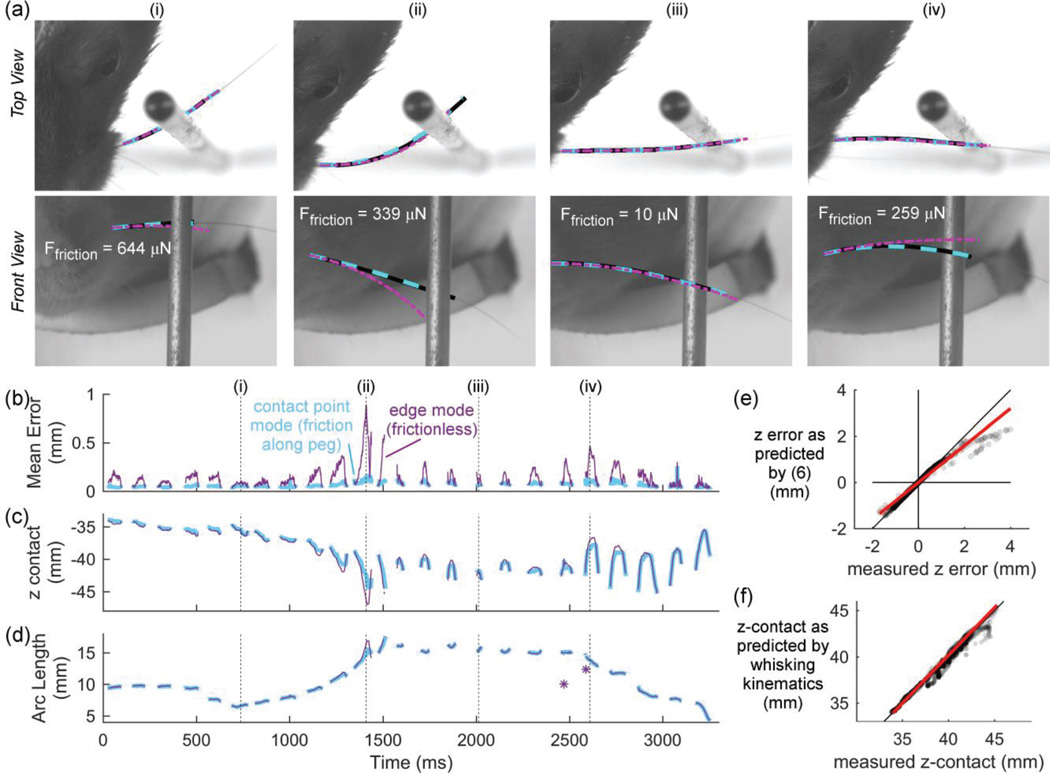
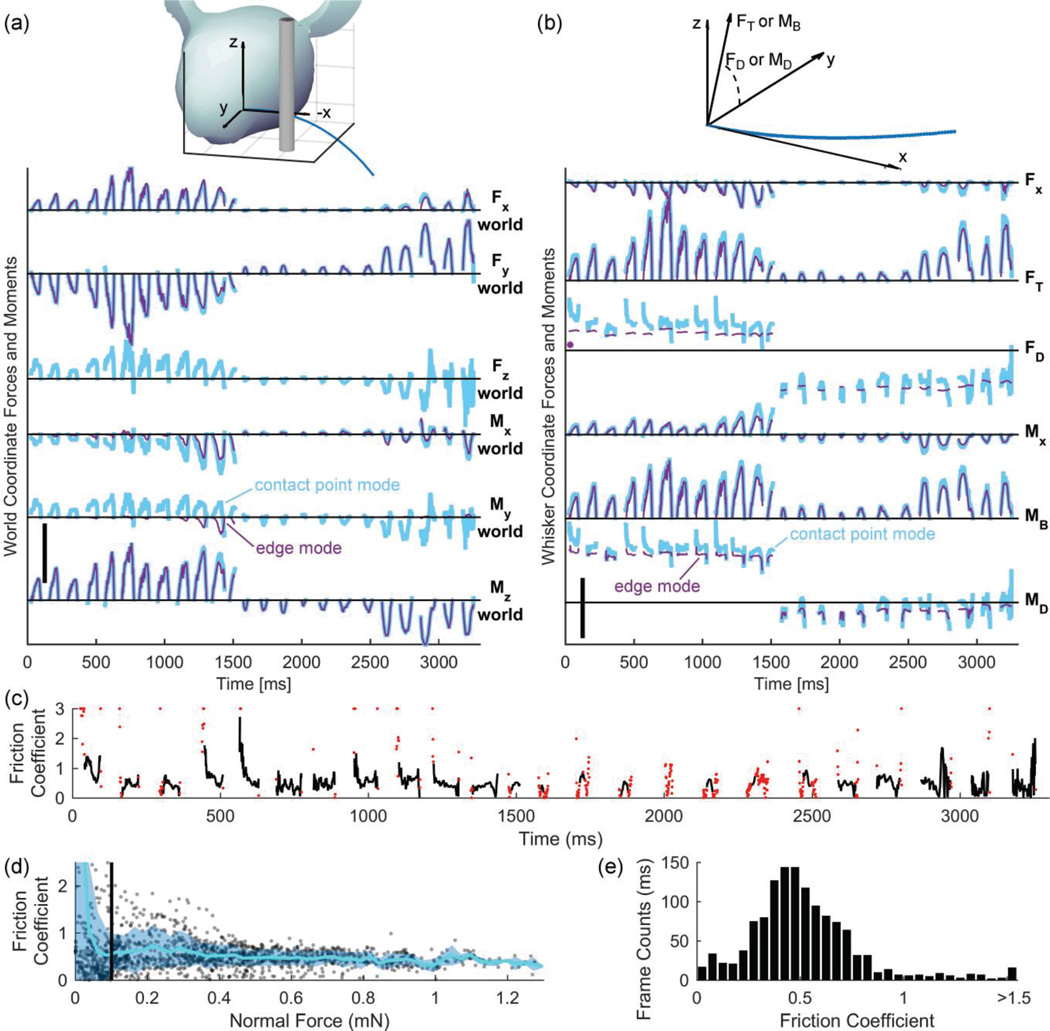
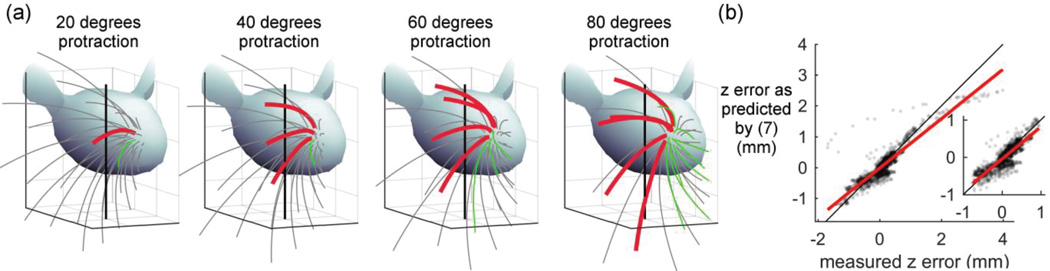
During tactile exploration, rats sweep their whiskers against objects in a motion called whisking. Here, we investigate how a whisker slips along an object's edge and how friction affects the resulting tactile signals. First, a frictionless model is developed to simulate whisker slip along a straight edge and compared with a previous model that incorporates friction but cannot simulate slip. Results of both models are compared to behavioral data obtained as a rat whisked against a smooth, stainless steel peg. As expected, the frictionless model predicts larger magnitudes of vertical slip than observed experimentally. The frictionless model also predicts forces and moments at the whisker base that are smaller and have a different direction than those predicted by the model with friction. Estimates for the friction coefficient yielded values near 0.48 (whisker/stainless steel). The present work provides the first assessments of the effects of friction on the mechanical signals received by the follicle during active whisking. It also demonstrates a proof-of-principle approach for reducing whisker tracking requirements during experiments and demonstrates the feasibility of simulating a full array of vibrissae whisking against a peg.
Figures
Similar articles
-
Tactile signals transmitted by the vibrissa during active whisking behavior.J Neurophysiol. 2015 Jun 1;113(10):3511-8. doi: 10.1152/jn.00011.2015. Epub 2015 Apr 1. J Neurophysiol. 2015. PMID: 25867739 Free PMC article.
-
Mechanical signals at the base of a rat vibrissa: the effect of intrinsic vibrissa curvature and implications for tactile exploration.J Neurophysiol. 2012 May;107(9):2298-312. doi: 10.1152/jn.00372.2011. Epub 2012 Feb 1. J Neurophysiol. 2012. PMID: 22298834 Free PMC article.
-
Bilateral Discrimination of Tactile Patterns without Whisking in Freely Running Rats.J Neurosci. 2017 Aug 9;37(32):7567-7579. doi: 10.1523/JNEUROSCI.0528-17.2017. Epub 2017 Jun 29. J Neurosci. 2017. PMID: 28663200 Free PMC article.
-
The mathematical whisker: A review of numerical models of the rat׳s vibrissa biomechanics.J Biomech. 2016 Jul 5;49(10):2007-2014. doi: 10.1016/j.jbiomech.2016.05.019. Epub 2016 May 24. J Biomech. 2016. PMID: 27260019 Review.
-
A night in the life of a rat: vibrissal mechanics and tactile exploration.Ann N Y Acad Sci. 2011 Apr;1225:110-8. doi: 10.1111/j.1749-6632.2011.06007.x. Ann N Y Acad Sci. 2011. PMID: 21534998 Review.
Cited by
-
Quantification of vibrissal mechanical properties across the rat mystacial pad.J Neurophysiol. 2019 May 1;121(5):1879-1895. doi: 10.1152/jn.00869.2016. Epub 2019 Feb 27. J Neurophysiol. 2019. PMID: 30811257 Free PMC article.
-
Whisker Vibrations and the Activity of Trigeminal Primary Afferents in Response to Airflow.J Neurosci. 2019 Jul 24;39(30):5881-5896. doi: 10.1523/JNEUROSCI.2971-18.2019. Epub 2019 May 16. J Neurosci. 2019. PMID: 31097620 Free PMC article.
-
The Cellular and Mechanical Basis for Response Characteristics of Identified Primary Afferents in the Rat Vibrissal System.Curr Biol. 2020 Mar 9;30(5):815-826.e5. doi: 10.1016/j.cub.2019.12.068. Epub 2020 Jan 30. Curr Biol. 2020. PMID: 32004452 Free PMC article.
-
Variations in vibrissal geometry across the rat mystacial pad: base diameter, medulla, and taper.J Neurophysiol. 2017 Apr 1;117(4):1807-1820. doi: 10.1152/jn.00054.2016. Epub 2016 Nov 23. J Neurophysiol. 2017. PMID: 27881718 Free PMC article.
-
Behavioral and Neural Bases of Tactile Shape Discrimination Learning in Head-Fixed Mice.Neuron. 2020 Dec 9;108(5):953-967.e8. doi: 10.1016/j.neuron.2020.09.012. Epub 2020 Sep 30. Neuron. 2020. PMID: 33002411 Free PMC article.
References
-
- Robinson F. A Study of Sensory Control in the Rat. Vol. 12. Lancaster, PA; Baltimore, MD: The Review publishing company; 1909.
-
- Vincent SB. The functions of the vibrissae in the behavior of the white rat. Vol. 1. University of Chicago; 1912.
-
- Welker W. Analysis of sniffing of the albino rat. Behaviour. 1964:223–244.
-
- Berg RW, Kleinfeld D. Rhythmic whisking by rat: retraction as well as protraction of the vibrissae is under active muscular control. Journal of neurophysiology. 2003;89:104–117. - PubMed
Publication types
MeSH terms
Grants and funding
LinkOut - more resources
Full Text Sources
Other Literature Sources
Research Materials
