. 2016 Feb 1:6:20272.
doi: 10.1038/srep20272.

Precursor and mature NGF live tracking: one versus many at a time in the axons

Affiliations

Precursor and mature NGF live tracking: one versus many at a time in the axons

Teresa De Nadai et al. Sci Rep. .

Erratum in

Abstract

The classical view of nerve growth factor (NGF) action in the nervous system is linked to its retrograde axonal transport. However, almost nothing is known on the trafficking properties of its unprocessed precursor proNGF, characterized by different and generally opposite biological functions with respect to its mature counterpart. Here we developed a strategy to fluorolabel both purified precursor and mature neurotrophins (NTs) with a controlled stoichiometry and insertion site. Using a single particle tracking approach, we characterized the axonal transport of proNGF versus mature NGF in living dorsal root ganglion neurons grown in compartmentalized microfluidic devices. We demonstrate that proNGF is retrogradely transported as NGF, but with a lower flux and a different distribution of numbers of neurotrophins per vesicle. Moreover, exploiting a dual-color labelling technique, we analysed the transport of both NT forms when simultaneously administered to the axon tips.


Figures
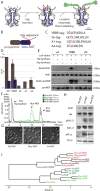
Figure 1
Figure 1. Schematic overview of production of fluorescent NTs and characterization of fluo-NGF biological activity.
(A) Cartoon depicting the two-steps labelling strategy. Structure of human NGF (blue ribbon, PDB 1SG1) with overlaid, in grey, the pro-peptide domain (Left); the tag sequence inserted at the C-terminal position of proNGF is depicted in red (Middle); the complete structural formula of Alexa488-maleimide-phosphopantetheinyl is added, highlighted in green (Right). (B) Scheme of proNGF sequence with highlighted tag insertion site. (C) Amino acidic sequence of the four screened tags, with the serine residue covalently conjugated to the fluorophore highlighted in red. (D) Purification yields (mg of product per litre of bacterial culture) of tagged proNGF-tag (gray) and NGF-tag (blue), compared to wt (pro)NGF. (E) Western blot analysis of the biotinylation reaction of purified NGF-YBBR and NGF-A4 using CoA-biotin substrate and AcpS or SfpS PPTases. The same biotinylation reaction is performed in parallel using untagged wt-NGF as negative control. Streptavidin-HRP is used for biotin detection. The anti-NGF blot (NGF and proNGF lines) is the loading control. (F) The HPLC chromatogram of NGF-YBBR, incubated with CoA-Alexa488 substrate in the presence and absence of Sfp-synthase, showing the different retention times of fluorescent and non-fluorescent NTs. Absorbance curves at 280 and 490 nm are reported. (G) Typical DIC images of PC12 differentiation assay using equimolar amounts of wt-NGF and fluo-NGF. Untreated cells are the control. Scale bars represent 20 μm. (H) Western blot analysis of phosphorylated Akt (pAkt), phosphorylated Erk1/2 (pErk1/2) and phosphorylated PLCγ (pPLCγ) protein levels in PC12 cells in response to wt NGF and fluo-NGF, compared to the same obtained for untreated cells (No NGF); the signal of the total corresponding signalling effectors is the loading control. (I) Hierarchical clustering tree of samples, corresponding to the different experimental points (for each neurotrophin type four individual PC12 cells administrations were performed). The trees show the gene expression similarity between samples. The x-axis indicates the distance between samples. Euclidean distance is the chosen metric, with average linkage clustering, using all normalized Log2 data.
Figure 2
Figure 2. Live axonal transport of fluo-NGF and fluo-proNGF.
(A,E,I,M) Schematic picture of the microfluidic device where, in the uppermost panel, the axon compartment (AC), the channel compartment (CC), and the soma compartment (SC) are indicated. The green droplets represent NT administration; a stylized microscope indicates the compartment in which fluorescence acquisition is performed; arrows of different dimensions schematize the direction and amount of detected moving vesicles. (B,F,J,N) Representative images of the time lapse videos of moving vesicles travelling through the axon. Each coloured line represents a single vesicle trajectory. (C,G,K,O) Displacement vs time plot of 200 representative vesicles. (D,H,L,P) Bars: average speed distribution of moving vesicles. Lines: distribution of speed during active movement. Empty triangles indicate the mean of vesicles average speed while filled triangles indicate the average speed during active movements; uncertainties are standard deviations. The number of acquired trajectories is reported in each panel. Distributions with areas normalized to 1; in (C,D,G,H,K,L), positive and negative displacements or speeds refer to retrograde and anterograde movements respectively, in the configuration described in M-P only the absolute value of displacements and speeds could be determined.
Figure 3
Figure 3. Quantification of NTs number carried by each vesicle.
(A) Schematization of NT number analysis for both fluo-NGF and fluo-proNGF. A representative re-centered vesicle intensity profile with the corresponding Gaussian fit is reported for both NTs. Scale bar 1μm. (B) 2D histograms of NT number carried by vesicles vs average speed. The number of analyzed vesicles is reported in each panel.
Figure 4
Figure 4. Co-administration of fluo-NGF and fluo-proNGF to the axon compartment.
(A) Representative images of the time lapse videos of moving vesicles travelling through the axon, at time 0s and after 25 sec; colocalizing (yellow) indicate the vesicles with both NGF and proNGF. (B) Displacement vs time for a representative 10% of all observed vesicles. The colour code is the same as in panel A. (C) Histograms for the number of fluo-proNGF and fluo-NGF per vesicle in non-colocalizing (proNGF red and NGF green) vesicles. (D) Histogram representing mean ± SD of the number of vesicles observed per 1mm of axons in the single administration of fluo-NGF and fluo-proNGF case (light grey and dark grey bars) and in case of coadministration (green and red bars). Dunn’s Multiple Comparison Test was performed, ***indicates p < 0.001.

References

    1. Nykjaer A., Willnow T. E. & Petersen C. M. p75NTR-live or let die. Curr. Opin. Neurobiol. 15, 49–57 (2005). - PubMed
    1. Cattaneo A. & Calissano P. Nerve growth factor and Alzheimer’s disease: new facts for an old hypothesis. Mol. Neurobiol. 46, 588–604 (2012). - PubMed
    1. Hempstead B. L. Dissecting the diverse actions of pro- and mature neurotrophins. Curr. Alzheimer Res. 3, 19–24 (2006). - PubMed
    1. Iulita M. F. & Cuello A. C. Nerve growth factor metabolic dysfunction in Alzheimer’s disease and Down syndrome. Trends Pharmacol. Sci. 35, 338–48 (2014). - PubMed
    1. Fahnestock M., Michalski B., Xu B. & Coughlin M. D. The precursor pro-nerve growth factor is the predominant form of nerve growth factor in brain and is increased in Alzheimer’s disease. Mol. Cell. Neurosci. 18, 210–220 (2001). - PubMed

Publication types