. 2016 Feb 1;36(7):1206-18.
doi: 10.1128/MCB.00971-15.

Aquaporin-3 Controls Breast Cancer Cell Migration by Regulating Hydrogen Peroxide Transport and Its Downstream Cell Signaling

Affiliations

Aquaporin-3 Controls Breast Cancer Cell Migration by Regulating Hydrogen Peroxide Transport and Its Downstream Cell Signaling

Hiroki Satooka et al. Mol Cell Biol. .

Abstract

Most breast cancer mortality is due to clinical relapse associated with metastasis. CXCL12/CXCR4-dependent cell migration is a critical process in breast cancer progression; however, its underlying mechanism remains to be elucidated. Here, we show that the water/glycerol channel protein aquaporin-3 (AQP3) is required for CXCL12/CXCR4-dependent breast cancer cell migration through a mechanism involving its hydrogen peroxide (H2O2) transport function. Extracellular H2O2, produced by CXCL12-activated membrane NADPH oxidase 2 (Nox2), was transported into breast cancer cells via AQP3. Transient H2O2 accumulation was observed around the membrane during CXCL12-induced migration, which may be facilitated by the association of AQP3 with Nox2. Intracellular H2O2 then oxidized PTEN and protein tyrosine phosphatase 1B (PTP1B) followed by activation of the Akt pathway. This contributed to directional cell migration. The expression level of AQP3 in breast cancer cells was related to their migration ability both in vitro and in vivo through CXCL12/CXCR4- or H2O2-dependent pathways. Coincidentally, spontaneous metastasis of orthotopic xenografts to the lung was reduced upon AQP3 knockdown. These findings underscore the importance of AQP3-transported H2O2 in CXCL12/CXCR4-dependent signaling and migration in breast cancer cells and suggest that AQP3 has potential as a therapeutic target for breast cancer.


Figures

FIG 1
FIG 1
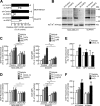
Transport of CXCL12-induced H2O2 into breast cancer cells through AQP3. (A) The mRNA levels of AQP3 in control (si-control)- or AQP3-siRNA (si-AQP3)-transfected MDA-MB-231 (top) and DU4475 (bottom) cells and in lentiviral control (sh-control)- or AQP3-shRNA (sh-AQP3)-infected MDA-MB-231 cells (middle) were assessed by real-time PCR. The data are expressed as percentages of AQP3 expression relative to β-actin (MDA-MB-231) or glyceraldehyde-3-phosphate dehydrogenase (GAPDH) (DU4475) expression of the control cells. The error bars indicate standard errors (SE) (n = 4 or 5; **, P < 0.01; *, P < 0.05). (B) Immunoblot analysis of plasma membrane-rich fraction with AQP3 and Na+/K+-ATPase antibodies in si-control or si-AQP3 of MDA-MB-231 (left) and DU4475 (right) cells and in sh-control or sh-AQP3 of MDA-MB-231 cells (middle). (C to F) MDA-MB-231 and DU4475 cells were transfected with control or AQP3 siRNA. (C) H2O2 uptake in control- or AQP3 RNAi (AQP3 KD)-transfected cells. The cells were incubated with H2O2 for 30 s, and cellular H2O2 was detected with H2DCFDA. The data are expressed as percentages of the DCF fluorescence of vehicle-added control cells (n = 4 to 6; H2O2 added versus vehicle, **, P < 0.01, and *, P < 0.05; control versus AQP3 KD, ††, P < 0.01). (D) Intracellular H2O2 was monitored by H2DCFDA following CXCL12 stimulation using a microplate reader (MDA-MB231) or by FACS analysis (DU4475). The cells were stimulated with CXCL12 for 30 s (n = 3 to 6; CXCL12 added versus vehicle, **, P < 0.01, and *, P < 0.05; control versus AQP3 KD, †† P < 0.01, and †, P < 0.05). (E) Intracellular H2O2 levels of MDA-MB-231 cells after treatment with DPI (20 μM; 30 min) or extracellular catalase (2,000 U/ml), followed by CXCL12 stimulation (100 ng/ml; 30 s). The data are expressed as percentages of the DCF fluorescence of cells with vehicle added (n = 4 to 6; **, P < 0.01). (F) Effect of Nox2 knockdown (si-Nox2) on cellular H2O2 levels. MDA-MB-231 cells were stimulated with CXCL12 (100 ng/ml) or H2O2 (100 μM) for 30 s (n = 6; stimulation versus vehicle, **, P < 0.01).
FIG 2
FIG 2
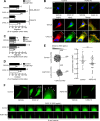
CXCL12-induced directional migration requires AQP3 and H2O2 uptake. (A to F) MDA-MB-231 and DU4475 cells were transfected with control or AQP3 siRNA. The error bars indicate SE. (A) The chemotaxis efficiency of control or AQP3 KD MDA-MB-231 and DU4475 cells toward CXCL12 (100 ng/ml; 6 h) was examined with an 8-μm-pore-size Transwell chamber (n = 4; control versus AQP3 KD, **, P < 0.01). (B) (Top) Confocal microscopy analysis of visualized F-actin polymerization of control or AQP3 KD MDA-MB-231 cells with phalloidin-Alexa Fluor 488 after CXCL12 stimulation (500 ng/ml; 5 min). The arrows indicate the polymerization of F-actin at the leading edge. (Bottom) Coimmunostaining with anti-AQP3 and anti-Nox2 antibodies after vehicle or CXCL12 stimulation (500 ng/ml; 5 min). Scale bars, 10 μm. The boxed areas are enlarged on the right. The arrows indicate AQP3 and Nox2 localization at the leading edge. (C) Chemotaxis of MDA-MB-231 cells treated with DPI (20 μM; 30 min) or extracellular catalase (2,000 U/ml) toward CXCL12 (100 ng/ml; 6 h) (n = 4; mock versus DPI or catalase, **, P < 0.01, and *, P < 0.05). (D) Transendothelial migration of control or AQP3 KD MDA-MB-231 cells through HUVEC in the presence of CXCL12 (100 ng/ml; 24 h) (n = 3; control versus AQP3 KD, **, P < 0.01, and *, P < 0.05). (E) Two-dimensional (2D) chemotaxis assay of control or AQP3 KD MDA-MB-231 cells toward a CXCL12 gradient (500 ng/ml; 12.5 h; 3-min intervals) using a μ-slide chemotaxis chamber. A total of 60 cells were manually analyzed with NIH ImageJ software. (Left) Chemotaxis in response to a CXCL12 gradient was analyzed with rose plots and Rayleigh's test for vector data (P = 3.43e−6 for control; P = 0.22 for AQP3 KD). (Right) The chemotaxis index (FMIII, forward migration index parallel to the gradient) was measured from the endpoint of the migration distance parallel to the CXCL12 gradient (n = 60; **, P < 0.01). The horizontal lines indicate the average of the chemotaxis index. (F) (Top) Fluorescent imaging of H2O2 uptake at the leading edge in HyPer-Cyto-transfected control and AQP3 KD cells after CXCL12 stimulation (500 ng/ml; 5 min). Scale bars, 50 μm. The arrows indicate H2O2 uptake at the leading edge. (Bottom) Time-lapse imaging of cellular H2O2 at the leading edge in HyPer-Cyto-transfected control and AQP3 KD cells after CXCL12 stimulation (500 ng/ml; 6-s intervals). Scale bars, 10 μm. The results are representative of more than seven independent experiments performed on at least 6 independent cells.
FIG 3
FIG 3
AQP3-dependent PTEN/PTP1B oxidation and Akt phosphorylation. (A to E) MDA-MB-231 cells were infected with lentiviral control or AQP3 shRNA, and DU4475 cells were transfected with control or AQP3 siRNA. (A) Immunoblot analysis of PTEN oxidation. Control or AQP3 KD MDA-MB-231 cells were stimulated with CXCL12 (100 ng/ml) or H2O2 (100 μM) for 1 min. The cell lysates were analyzed using antibodies against PTEN under nonreducing (top) or reducing (bottom) conditions. (B) The oxidation of PTP1B in control or AQP3 KD MDA-MB-231 cells was analyzed by immunoblotting (IB). After CXCL12 stimulation (100 ng/ml; 1 min), PTP1B (with or without IAA) was immunoprecipitated (IP) and analyzed with antibodies against the oxidized PTP active site. Total immunoprecipitated PTP1B was determined with the antibody against PTP1B. (C) Akt phosphorylation (P-Akt) (Ser 473) in CXCL12-stimulated control or AQP3 KD MDA-MB-231 (0 to 100 ng/ml; 3 min) and DU4475 (0 to 50 ng/ml; 3 min) cells was assessed by immunoblotting. (D) Effect of transfection of PTEN RNAi or cotransfection of AQP3 and PTEN RNAi on Akt phosphorylation of MDA-MB-231 cells in response to CXCL12 (100 ng/ml; 3 min). (E) Effect of transfection of PTP1B RNAi or cotransfection of AQP3 and PTP1B RNAi on Akt phosphorylation of MDA-MB-231 cells in response to CXCL12 (100 ng/ml; 3 min).
FIG 4
FIG 4
CXCL12-induced H2O2 regulates PTP1B/PTEN oxidation and Akt activation. (A to C, E, and F) MDA-MB-231 cells were infected with lentiviral control or AQP3 shRNA. (A and B) The effects of DPI (20 μM; 30 min) or catalase (2,000 U/ml) on PTEN (A) or PTP1B (B) oxidation induced by CXCL12 (100 ng/ml; 1 min) in MDA-MB-231 cells were analyzed by immunoblotting. (C) Akt phosphorylation (Ser 473) in DPI (20 μM; 30 min)- or catalase (2,000 U/ml)-treated MDA-MB-231 cells, followed by CXCL12 stimulation (100 ng/ml; 3 min). (D) MDA-MB-231 cells were transfected with control or AQP3 siRNA. Intracellular H2O2 levels were detected with H2DCFDA in control or AQP3 KD MDA-MB-231 cells stimulated with CXCL12 (100 ng/ml) and/or H2O2 (100 μM) for 30 s, 1 min, and 3 min (the error bars indicate SE; n = 4 to 6; CXCL12 added, AQP3 KD at 3 min versus CXCL12 added, control or CXCL12 plus H2O2 added, AQP3 KD at 3 min, **, P < 0.01). (E) Effects of costimulation with CXCL12 and H2O2 on Akt phosphorylation in AQP3 KD MDA-MB-231 cells. The cells were stimulated with H2O2 (100 μM) and/or CXCL12 (100 ng/ml) for 3 min. (F) PTEN (top) and PTP1B (bottom) oxidation in AQP3 KD MDA-MB-231 cells stimulated with CXCL12 (100 ng/ml) and/or H2O2 (100 μM) for 1 or 3 min.
FIG 5
FIG 5
AQP3 overexpression increases H2O2 uptake and cell migration upon CXCL12 stimulation. The error bars indicate SE. (A to F) MDA-MB-231 cells were transfected with the vector pCMV6 (empty [Emp]) or human AQP3-expressing pCMV6 (AQP3; 1 to 10 ng for 1.5 × 10⁴ cells). (A) The mRNA levels of AQP3 in empty-vector- or AQP3 vector-transfected cells were assessed by real-time PCR. The data are expressed as percentages of the AQP3 expression level relative to GAPDH expression of the empty-vector-transfected cells (n = 4; empty vector versus AQP3 vector, **, P < 0.01). (B) Immunoblot analysis of naive (NV) or empty-vector- or AQP3 vector-transfected MDA-MB-231 cells with anti-AQP3, anti-Na+/K+-ATPase, and anti-CD98 antibodies. (C) Confocal images of AQP3 in empty-vector- or AQP3 vector-transfected cells. The cells were stimulated with vehicle or CXCL12 (500 ng/ml) for 5 min. Scale bar, 10 μm. The arrows indicate the localization of AQP3 in the leading edge. (D) H2O2 uptake in empty-vector- or AQP3 vector-transfected cells. The cells were incubated with 100 μM H2O2 for 30 s, and cellular H2O2 was detected with H2DCFDA by a fluorescence microplate reader. The data are expressed as percentages of DCF fluorescence of empty-vector-transfected cells (n = 6; empty vector versus AQP3 vector, **, P < 0.01). (E) Intracellular H2O2 of empty-vector- or AQP3 vector-transfected cells was monitored by H2DCFDA following CXCL12 stimulation (100 ng/ml; 30 s) (n = 6; empty vector versus AQP3 vector, **, P < 0.01). (F) The chemotaxis efficiency of empty-vector- or AQP3 vector-transfected cells toward CXCL12 (100 ng/ml; 3 h) was examined using an 8-μm-pore-size Transwell chamber (n = 3; empty vector versus AQP3 vector, **, P < 0.01, and *, P < 0.05). (G) Akt phosphorylation (Ser 473) in empty-vector- or AQP3 vector (10 ng)-transfected cells after CXCL12 stimulation (0 to 100 ng/ml; 3 min) was assessed by immunoblotting. (H) (Left) Coimmunoprecipitation assay showing the presence of a complex between AQP3 and Nox2 in MDA-MB-231 cells. The plasma membrane-rich fraction (PM) was solubilized in RIPA buffer and immunoprecipitated with an AQP3 or Nox2 antibody. (Right) Immunoblot analysis was performed with PM- and RIPA-extracted fractions to confirm plasma membrane enrichment.
FIG 6
FIG 6
Involvement of AQP3 expression in breast cancer cell migration in vivo. The error bars indicate SE. (A to D) MDA-MB-231 cells (8.0 × 10⁵ cells) were intravenously injected into SCID mice, and the numbers of cells in the lungs after 24 h were analyzed by flow cytometry. (A) Control and AQP3 KD cells (turbo-GFP-expressing control or AQP3 shRNA) were injected (n = 9; **, P < 0.01). (B) Empty-vector- and AQP3 vector-transfected cells were injected (n = 11; **, P < 0.01). (C) Vehicle- and AMD3100-treated cells (10 μM; 30 min) were injected (n = 8; *, P < 0.05). (D) Effect of the H2O2 scavenger NAC on lung metastasis. Control cells (8.0 × 10⁵ cells) were intravenously injected into SCID mice supplemented with NAC (10 mg/ml, 4 days) or given regular water (n = 4 to 6; *, P < 0.05).
FIG 7
FIG 7
AQP3 knockdown abrogates spontaneous metastasis to the lungs. (A to F) Control or AQP3 KD MDA-MB-231 cells (turbo-GFP-expressing control or AQP3 shRNA; 1.0 × 10⁶ cells) were orthotopically injected into SCID mice. Primary tumors and lungs were analyzed at 11 weeks posttransplantation. (A) Tumor sizes were measured weekly for 11 weeks. (The error bars indicate SE; n = 9 or 10.) (B) The numbers of MDA-MB-231 cells in primary tumor (left) or lung (right) tissues were detected by flow cytometry (n = 9 to 11; *, P < 0.05). (C) (Top) GFP-expressing cells (green) were detected in the lungs by confocal microscopy. Scale bar, 50 μm. (Middle and bottom) H&E staining of the lungs. The boxed areas are enlarged on the bottom row. Scale bars, 100 μm (middle) and 20 μm (bottom). The arrows indicate the extrinsic cells in lung. (D and E) Immunofluorescence of AQP3 in primary tumor (D) and lung (E) tissues. Frozen sections were stained with antibodies against AQP3 (red) and human EpCAM (green). Scale bars, 20 μm (D) and 10 μm (E). (F) Immunofluorescence of phospho-Akt (Ser 473) (red) in primary tumor tissues. Scale bar, 50 μm. Enlarged images are shown in the insets.

Similar articles

Cited by

References

    1. Brenner B, Siris N, Rakowsky E, Fenig E, Sulkes A, Lurie H. 2002. Prediction of outcome in locally advanced breast cancer by post-chemotherapy nodal status and baseline serum tumour markers. Br J Cancer 87:1404–1410. doi:10.1038/sj.bjc.6600616. - DOI - PMC - PubMed
    1. Chaffer CL, Weinberg RA. 2011. A perspective on cancer cell metastasis. Science 331:1559–1564. doi:10.1126/science.1203543. - DOI - PubMed
    1. Roussos ET, Condeelis JS, Patsialou A. 2011. Chemotaxis in cancer. Nat Rev Cancer 11:573–587. doi:10.1038/nrc3078. - DOI - PMC - PubMed
    1. Müller A, Homey B, Soto H, Ge N, Catron D, Buchanan ME, McClanahan T, Murphy E, Yuan W, Wagner SN, Barrera JL, Mohar A, Verástegui E, Zlotnik A. 2001. Involvement of chemokine receptors in breast cancer metastasis. Nature 410:50–56. doi:10.1038/35065016. - DOI - PubMed
    1. Minn AJ, Gupta GP, Siegel PM, Bos PD, Shu W, Giri DD, Viale A, Olshen AB, Gerald WL, Massague J. 2005. Genes that mediate breast cancer metastasis to lung. Nature 436:518–524. doi:10.1038/nature03799. - DOI - PMC - PubMed

Publication types