. 2016 Feb 2:6:20438.
doi: 10.1038/srep20438.

Knockin of Cre Gene at Ins2 Locus Reveals No Cre Activity in Mouse Hypothalamic Neurons

Affiliations

Knockin of Cre Gene at Ins2 Locus Reveals No Cre Activity in Mouse Hypothalamic Neurons

Ling Li et al. Sci Rep. .

Abstract

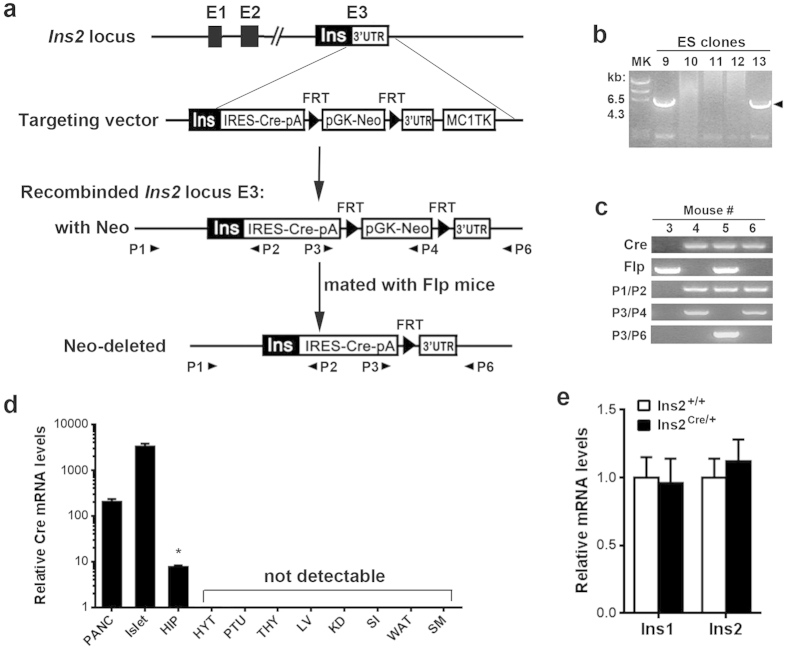
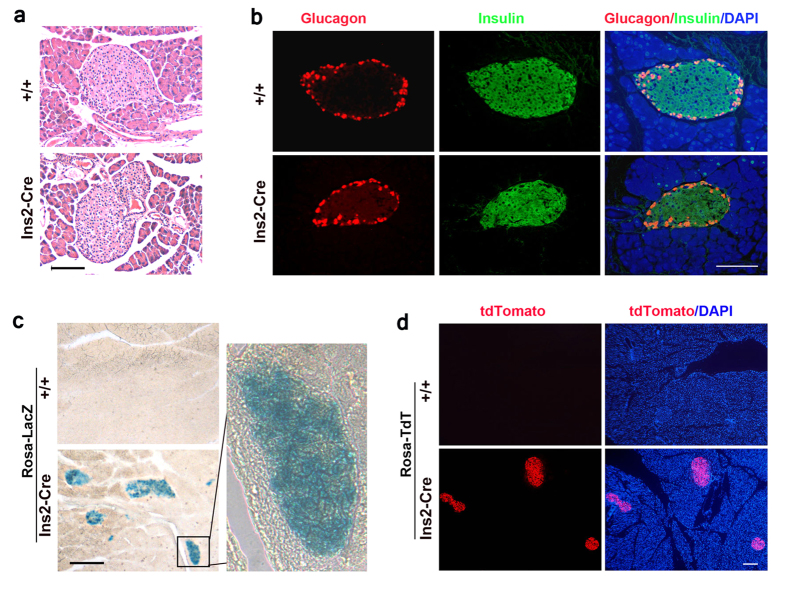
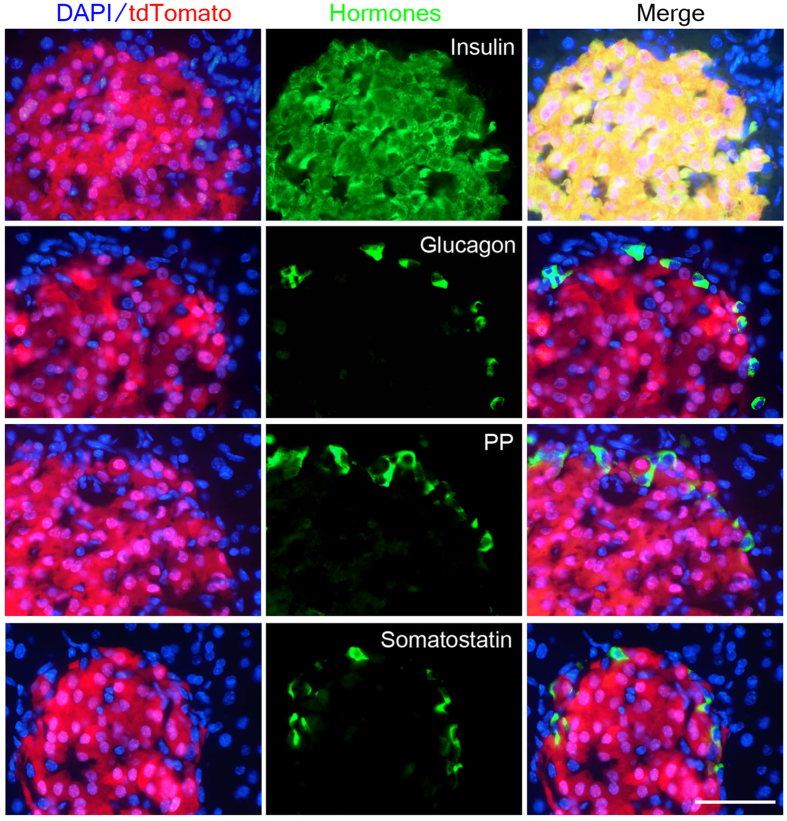
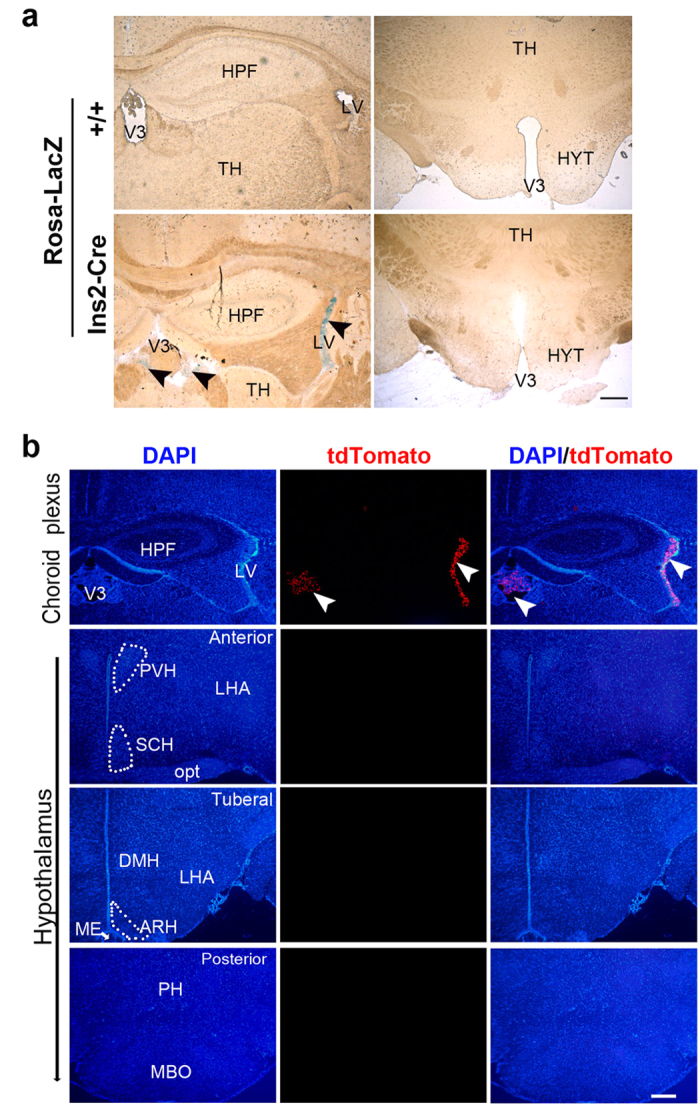
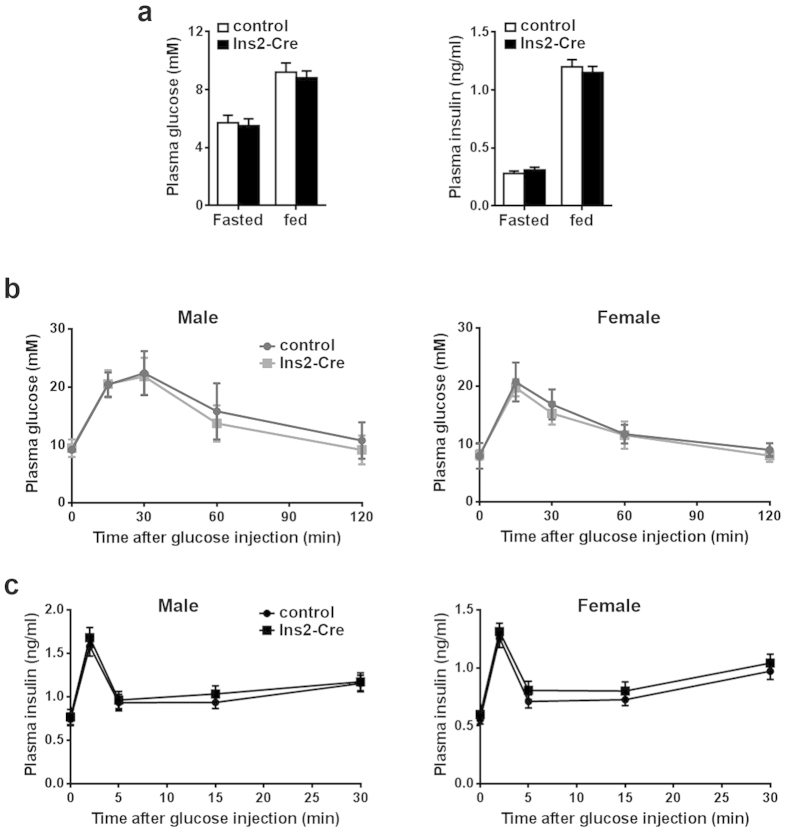
The recombination efficiency and cell specificity of Cre driver lines are critical for exploring pancreatic β cell biology with the Cre/LoxP approach. Some commonly used Cre lines are based on the short Ins2 promoter fragment and show recombination activity in hypothalamic neurons; however, whether this stems from endogenous Ins2 promoter activity remains controversial. In this study, we generated Ins2-Cre knockin mice with a targeted insertion of IRES-Cre at the Ins2 locus and demonstrated with a cell lineage tracing study that the Ins2 gene is not transcriptionally active in the hypothalamus. The Ins2-Cre driver line displayed robust Cre expression and activity in pancreatic β cells without significant alterations in insulin expression. In the brain, Cre activity was mainly restricted to the choroid plexus, without significant recombination detected in the hippocampus or hypothalamus by the LacZ or fluorescent tdTomato reporters. Furthermore, Ins2-Cre mice exhibited normal glucose tolerance and insulin secretion upon glucose stimulation in vivo. In conclusion, this Ins2-Cre driver line allowed high-fidelity detection of endogenous Ins2 promoter activity in vivo, and the negative activity in the hypothalamus demonstrated that this system is a promising alternative tool for studying β cell biology.


Figures

Figure 1
Figure 1. Generation of Ins2-Cre knockin mice.
(a) Schematic demonstration for knockin of Cre gene at the Ins2 locus by homologous recombination. The targeting vector contains the IRES-Cre-pA and FRT-flanked Neo cassette, which was inserted between the stop codon and 3′ UTR of the 3rd exon of Ins2. After successful homologous recombination in ES cells, the recombined allele continued into the germline. The Neo cassette was removed by crossing onto Flp mice. The genotyping PCR primers (P1-P6) were indicated as their corresponding location of the genome. (b) PCR analysis of genomic DNA for the indicated ES clones. A specific band size of 5.6 kb was amplified from positive clones (9 and 13) by PCR using primers P1/P2, indicating homologous recombination at the Ins2 locus. (c) PCR genotyping revealed the identification of the mouse line with the Neo cassette deleted by Flp. In mouse #5, Neo cassette deletion was evidenced by the null PCR amplification using primers P3/P4. (d) Cre mRNA expression in different tissues from Ins2-Cre mice. PANC, pancreas; HIP, hippocampus; HYT, hypothalamus; LV, liver; KD, kidney; SM, skeletal muscle; WAT, white adipose tissue; PTU, pituitary; THY, thymus; SI, small intestine. *P < 0.001 vs pancreas. N = 4. (e) Ins1 and Ins2 mRNA expression levels in the islets were not significantly different between control and Ins2-Cre mice. P > 0.05 vs control. N = 4.
Figure 2
Figure 2. Cre recombination activity in the pancreatic islets of Ins2-Cre mice.
(a–b) Normal islet architecture of heterozygous Ins2-Cre mice demonstrated by HE staining (a) and double immunostaining for glucagon and insulin (b). DAPI was used for nuclear counterstaining. Scale bar, 100 μm. (c) Cre recombination activity in islets shown by X-gal staining in Ins2-Cre mice crossed onto Rosa-LacZ reporter line. Scale bar, 250 μm. (d) Cre recombination activity in islets shown by tdTomato fluorescence in Ins2-Cre mice crossed onto Rosa-tdTomato reporter line (Ai14). TdT, tdTomato. Scale bar, 200 μm.
Figure 3
Figure 3. Efficient and specific Cre-mediated recombination in pancreatic β cells from the islets of Ins2-Cre mice.
Pancreatic cryosections from Ins2-Cre;Rosa-tdTomato mice were subjected to immunostaining for insulin, glucagon, pancreatic polypeptide (PP), and somatostatin. Cre-mediated recombination occurred only in insulin-expressing cells with high efficiency but not in other hormone-expressing islet cells. Scale bar, 50 μm.
Figure 4
Figure 4. Cre recombination activity detected in the choroid plexus but not in the hypothalamus of Ins2-Cre mice.
(a) X-gal staining of coronal brain sections showing Cre recombination activity in the choroid plexus of Ins2-Cre;Rosa-LacZ mice. The blue signals in the choroid plexus in the lateral (LV) and third ventricles (V3) are indicated by black arrow heads. No significant staining was detected in the hypothalamus (HYT). Scale bar, 250 μm. (b) Representative coronal brain sections of Ins2-Cre;Rosa-tdTomato mice showing that tdTomato was expressed in the choroid plexus in the LV and V3 and undetectable in the anterior, tuberal, and posterior hypothalamus. ARH, arcuate hypothalamic nucleus; DMH, dorsomedial nucleus of the hypothalamus; HPF, hippocampal formation; PVH, paraventricular hypothalamic nucleus; SCH, suprachiasmatic nucleus; LHA, lateral hypothalamic area; MBO, mammillary body; ME, median eminence; Opt, optic tract; PH, posterior hypothalamic nucleus; TH, thalamus. Scale bar, 200 μm.
Figure 5
Figure 5. Normal insulin secretion and glucose homeostasis of Ins2-Cre mice.
At the age of 3 ~ 4 months old, adult heterozygous male or female Ins2-Cre mice and their age and sex-matched control counterparts were metabolically analyzed. (a) Plasma glucose and insulin levels for fasted or fed states in male mice. There was no significant difference between control and Ins2-Cre mice. Each group consisted of four animals. (b) Glucose tolerance test on male or female mice. Glucose (2 g/kg body weight) was i.p. injected into the mice, and plasma glucose levels were measured at indicated time points. Each group consisted of six animals. (c) Glucose-stimulated insulin secretion after intraperitoneal injection of glucose at indicated time. Glucose (2 g/kg body weight) was i.p. injected into the mice, and plasma glucose levels were measured at indicated time points. Each group consisted of four animals.

References

    1. Deltour L. et al.. Differential expression of the two nonallelic proinsulin genes in the developing mouse embryo. Proc Natl Acad Sci USA 90, 527–531 (1993). - PMC - PubMed
    1. Duvillie B. et al.. Phenotypic alterations in insulin-deficient mutant mice. Proc Natl Acad Sci USA 94, 5137–5140 (1997). - PMC - PubMed
    1. Leroux L. et al.. Compensatory responses in mice carrying a null mutation for Ins1 or Ins2. Diabetes 50 Suppl 1, S150–153 (2001). - PubMed
    1. Hay C. W. & Docherty K. Comparative analysis of insulin gene promoters: implications for diabetes research. Diabetes 55, 3201–3213 (2006). - PubMed
    1. Mehran A. E. et al.. Hyperinsulinemia drives diet-induced obesity independently of brain insulin production. Cell Metab 16, 723–737 (2012). - PubMed

Publication types

MeSH terms

LinkOut - more resources