. 2016 Feb 1:7:10526.
doi: 10.1038/ncomms10526.

Stem cells of the suture mesenchyme in craniofacial bone development, repair and regeneration

Affiliations

Stem cells of the suture mesenchyme in craniofacial bone development, repair and regeneration

Takamitsu Maruyama et al. Nat Commun. .

Abstract

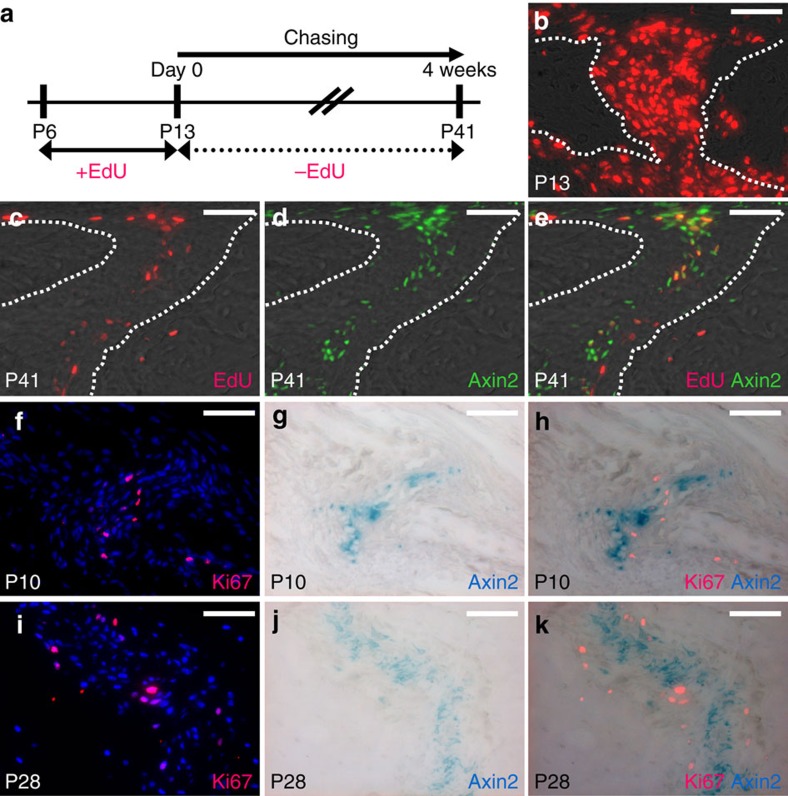
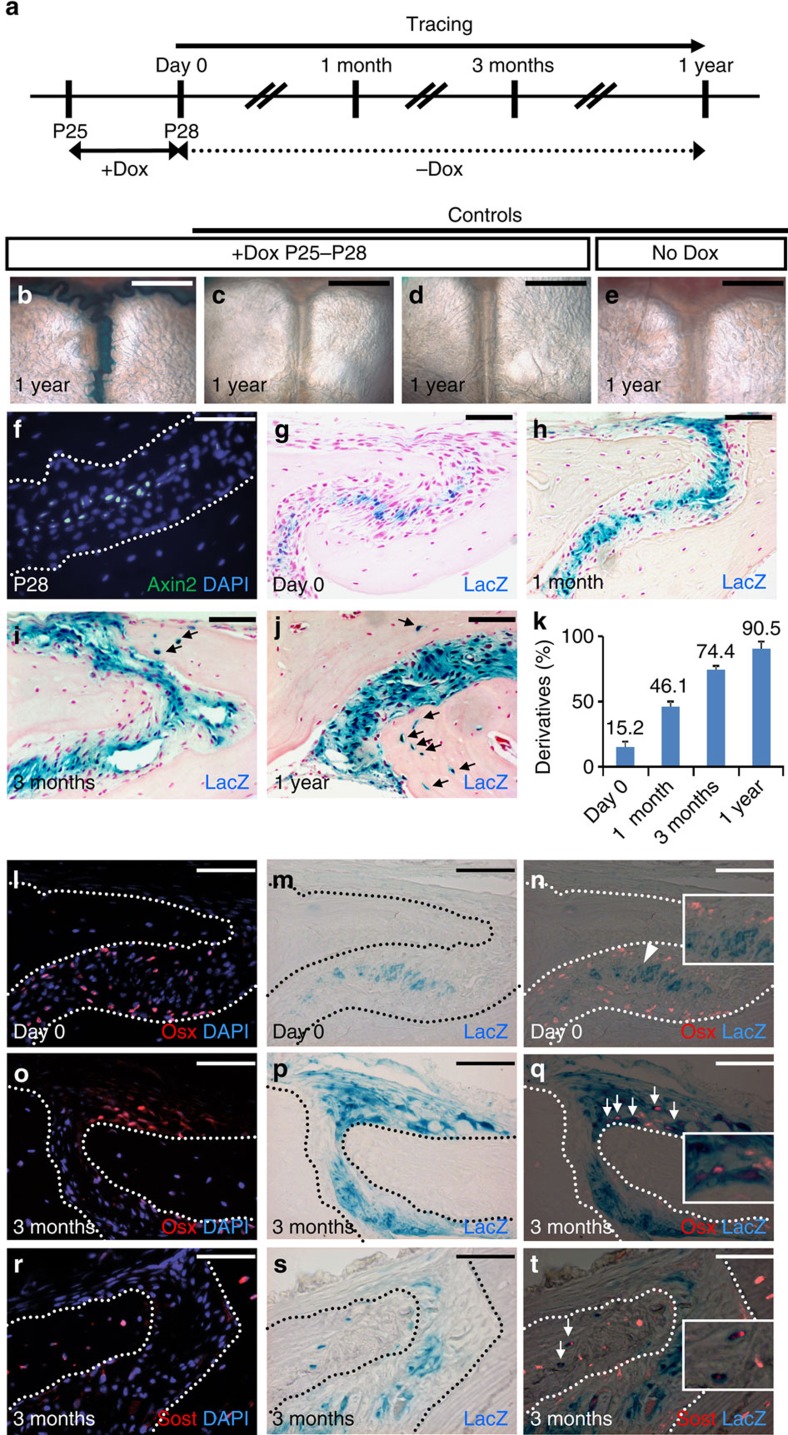
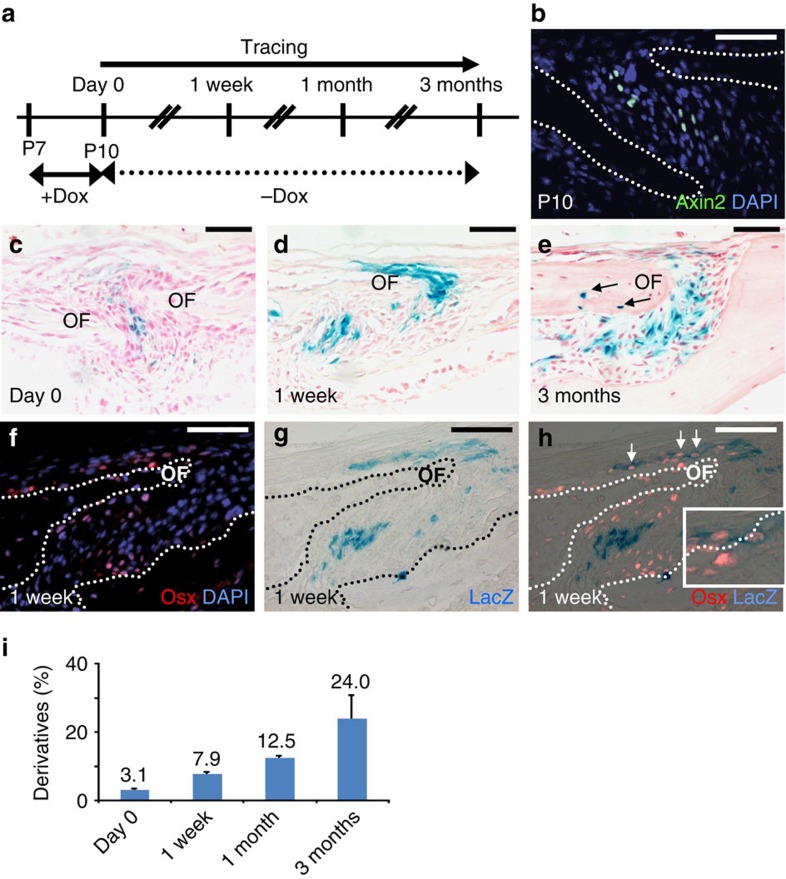
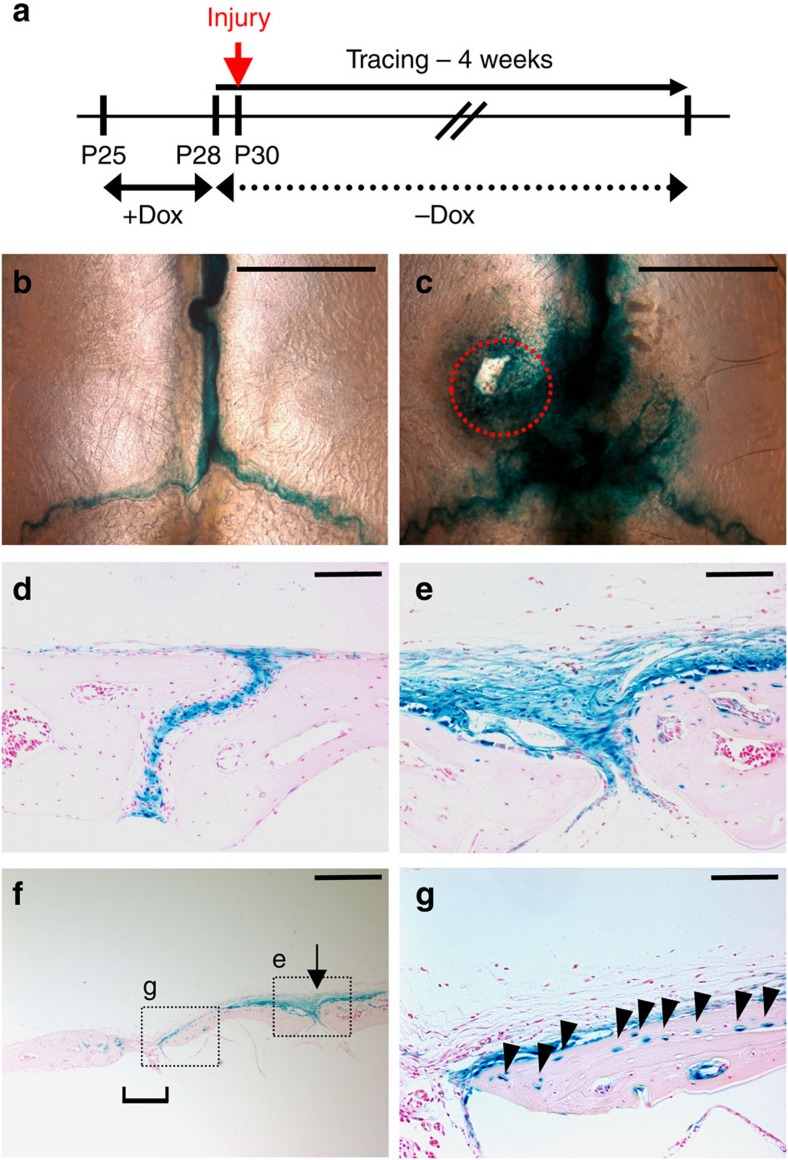
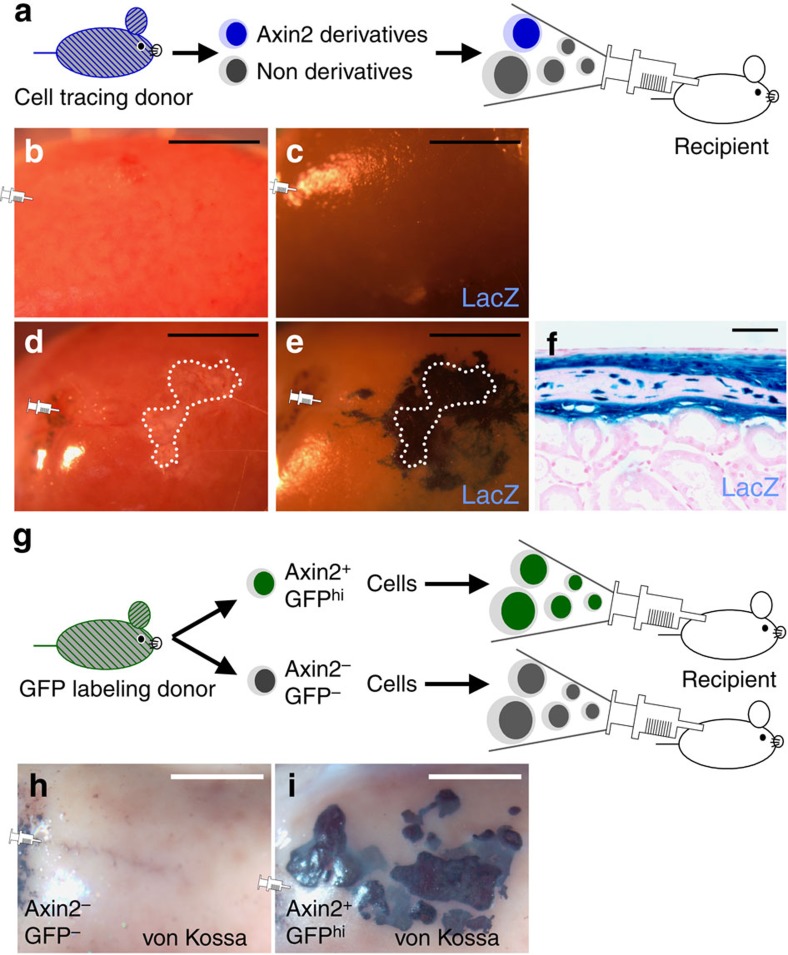
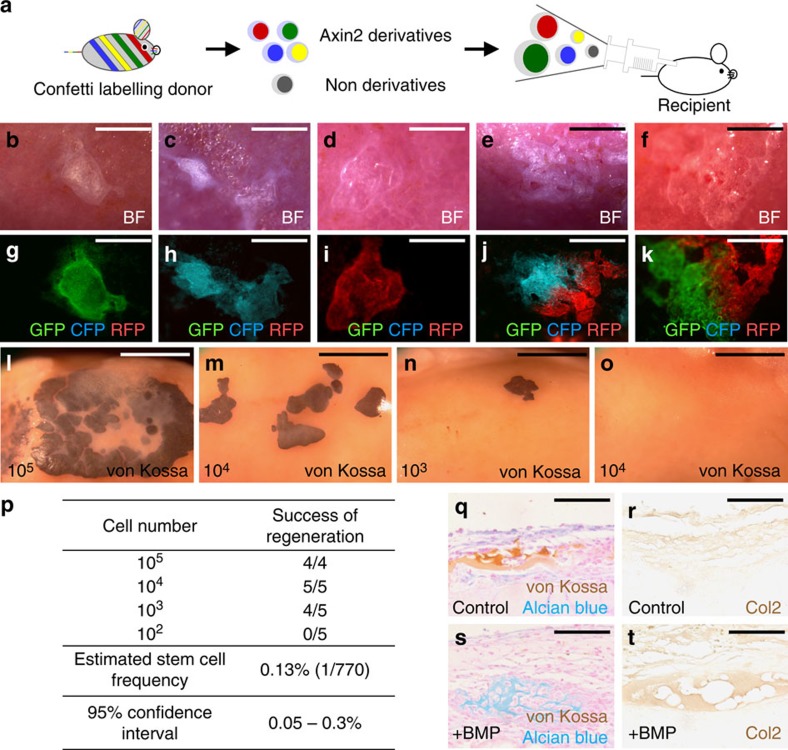
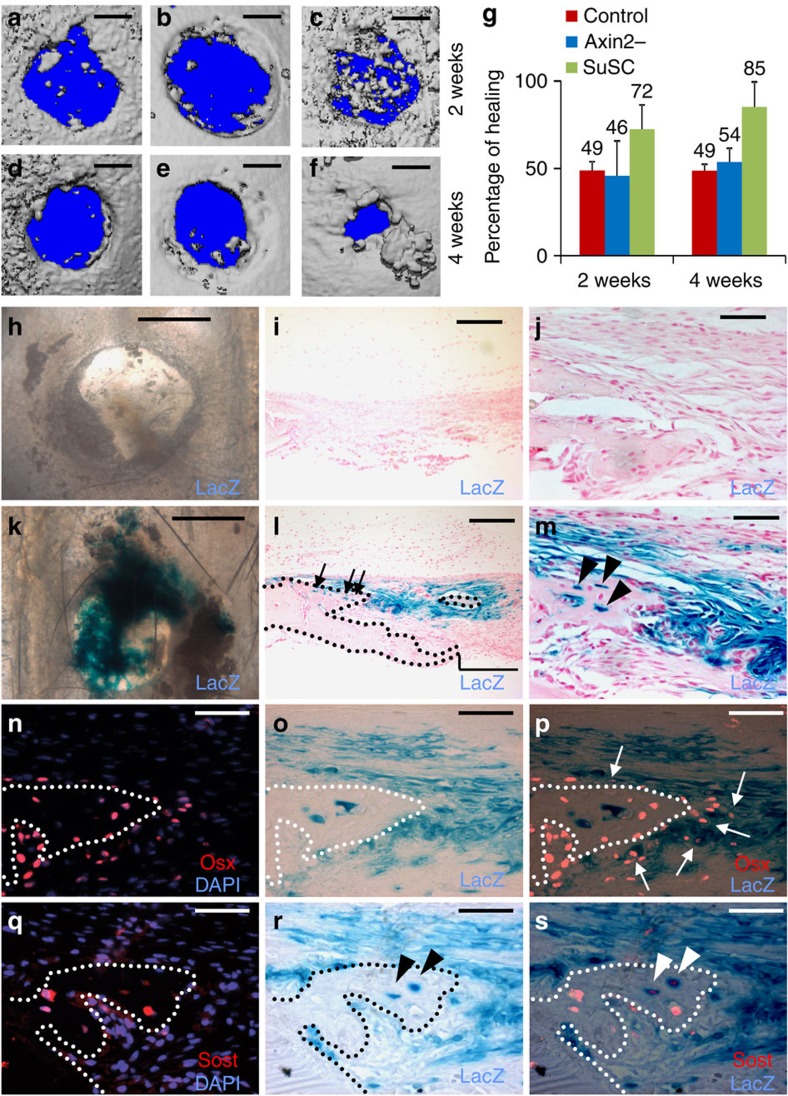
The suture mesenchyme serves as a growth centre for calvarial morphogenesis and has been postulated to act as the niche for skeletal stem cells. Aberrant gene regulation causes suture dysmorphogenesis resulting in craniosynostosis, one of the most common craniofacial deformities. Owing to various limitations, especially the lack of suture stem cell isolation, reconstruction of large craniofacial bone defects remains highly challenging. Here we provide the first evidence for an Axin2-expressing stem cell population with long-term self-renewing, clonal expanding and differentiating abilities during calvarial development and homeostastic maintenance. These cells, which reside in the suture midline, contribute directly to injury repair and skeletal regeneration in a cell autonomous fashion. Our findings demonstrate their true identity as skeletal stem cells with innate capacities to replace the damaged skeleton in cell-based therapy, and permit further elucidation of the stem cell-mediated craniofacial skeletogenesis, leading to revealing the complex nature of congenital disease and regenerative medicine.


Figures

Figure 1
Figure 1. Slow cycling cells expressing Axin2 reside in the midline of the suture mesenchyme.
(a) An illustration describes pulse-chase labelling analysis for identification of label-retaining cells. Sections of the pulse-chased Axin2GFP skull were analyzed by EdU staining before (b) and after the 4-week chase period (c), at P13 and P41, respectively. (d) The Axin2-expressing cells were detected by GFP. (e) Merged imaging examines cells positive for EdU and Axin2 expression. Sections of the skull were analyzed for cells active in mitotic division and expressing Axin2 by immunostaining of Ki67 and β-gal staining of lacZ, respectively, at P10 (fh) and P28 (ik). Images are representations from three independent experiments. Scale bar, 50 μm (bk).
Figure 2
Figure 2. Fate mapping analysis reveals a population exhibiting stem cell characteristics in skeletal homeostastic maintenance.
(a) A diagram illustrates spatiotemporal-specific tracing of the Axin2-expressing cells. β-gal staining of the skulls examines the Axin2-expressing cells and their descendants before tracing (Day 0; g,m), or after tracing for 1 month (h), 3 months (i,p,s) and 1 year (be,j). The Axin2-expressing cells are detected by GFP analysis at P28 before the start of tracing (f). Immunostaining analysis of Osterix (Osx) and Sost identifies osteogenic cell types before tracing (l) and after 3 months tracing (o,r). Double labelling analysis examines the expression of osteogenic markers in the Axin2-expressing cells and their derivatives before tracing (n) and after 3 months tracing (q,t). Statistical analysis indicates the ratio of the lacZ-positive cells during the 1-year-tracing period (k, ∼250 cells counted, n=3, mean±s.e.m.). Arrows and arrowhead indicate lacZ-expressing cells positive and negative for osteogenic marker, respectively. Genotypes: Axin2rtTA; TRE-Cre; R26R (b,e,gj,lt), Axin2-rtTA; R26R (c), TRE-Cre; R26R (d) and Axin2-rtTA; TRE-H2BGFP (f). Images are representatives of three (f,lt) and five (be,gj) independent experiments. Scale bar, 1 mm (be). Scale bar, 50 μm (fj,lt).
Figure 3
Figure 3. Cells expressing Axin2 are capable of self-renewal and differentiation into osteogenic cell types during skeletal development.
(a) A diagram illustrates tracing of the Axin2-expressing cells in developing calvarium. GFP analysis detects the Axin2-expressing cells at P10 before the start of tracing (b). The Axin2-expressing cells and their descendants before tracing (Day 0; c), or after tracing for 1 week (d) and 3 months (e) are identified by β-gal staining. Double labelling analysis examines the expression of Osx in the Axin2-expressing cells and their descendants after 1 week tracing (fh). Statistical analysis indicates that the ratio of the lacZ-positive cells gradually increases over time (i, ∼300 cells counted, n=3, mean±s.e.m.). Genotypes: Axin2-rtTA; TRE-H2BGFP (b) and Axin2rtTA; TRE-Cre; R26R (ch). Images are representatives of three independent experiments. Scale bar, 50 μm (bh). OF, osteogenic front.
Figure 4
Figure 4. Injury-induced expansion of Axin2-expressing cells undergoing osteoblast differentiation for skeletal repair.
(a) A diagram illustrates our strategy to map the Axin2-expressing cell fate in an injury repair model. Tracing analysis assesses the population of the Axin2-expressing cells and their descendants with (c,eg) or without (b,d) injury in whole mounts (b,c) and sections (dg) of the β-gal-stained Axin2Cre-Dox; R26R mice. Bracket, arrow and arrowheads indicate the unhealed region, suture mesenchyme and osteocytes in newly regenerated bones, respectively. Images are representatives of three independent experiments. Scale bar, 2 mm (b,c). Scale bar, 100 μm (d,e,g). Scale bar, 400 μm (f).
Figure 5
Figure 5. Skeletal stem cells residing in the suture mesenchyme are enriched in the Axin2-expressing cell population.
Diagrams illustrate our strategies to examine whether the regenerated bone originates from the Axin2-expressing cells (a) and to determine their regenerative potential (g) using the cell tracing and GFP labelling models, respectively. Transplantation with inclusion of no cell (b,c), or suture mesenchymal cells (df) isolated from the Axin2Cre-Dox; R26RlacZ mice, examines contribution of the Axin2-expressing cells and their derivatives, stained positive for β-gal, to the ectopic bone formation. Regeneration analysis is performed on the Axin2 (h) and Axin2+ (i) cell populations, isolated from the Axin2GFP calvaria, after their separation based on the differential expression of GFP. The transplanted kidneys are examined by gross evaluation (b,d), β-gal staining in whole mount (c,e) and sections (f) and von Kossa staining (h,i). Images in bf and hi are representatives of three independent experiments. Scale bar, 2 mm (be,hi). Scale bar, 50 μm (f).
Figure 6
Figure 6. Bone regeneration examines the clonal expansion, stem cell frequency and multipotency of SuSCs in vivo.
(a) Diagrams illustrate our strategies to examine stem cell characteristics of the Axin2-expressing cells at a single-cell level using Axin2Cre-Dox; R26RConfetti. Ectopic bone formation is assessed by gross evaluation (bf), fluorescent imaging (gk), von Kossa staining (lo) in whole mounts. Limiting dilution analysis shows the success of bone regeneration with transplantation of 105, 104 and 103, but not 102 cells (lo), providing a quantitative assessment for the stem cell frequency using ELDA software (p). The transplanted suture cells with (st) or without (qr) addition of BMP2 were analyzed by double labelling of von Kossa and alcian blue (q,s) and immunostaining of type II collagen (r,t). Images are representatives of three (bk,qt), four (l) and five (mo) independent experiments. Scale bar, 400 μm (bd,gi). Scale bar, 500 μm (ef,jk). Scale bar, 2 mm (lo). Scale bar, 50 μm (qt).
Figure 7
Figure 7. SuSCs improve bone healing through direct engraftment.
The reparative ability of SuSC is examined by implanting without (a,d,hj), or with suture mesenchymal cells containing Axin2 (b,e) or Axin2+ (c,f,ks) in the injury repair model. Two (ac,hs) and 4 (df) weeks after operation the healing process is assessed by micro CT (af), β-gal staining (hm,op,rs) and immunostaining of Osx (n,p) and Sost (q,s) in whole mounts (af,h,k) and sections (ij,ls). The graph shows the average per cent of healing at 2 and 4 weeks post operation (g, n=3, mean±s.e.m.; P value<0.05, Student t-test). Arrows, arrowheads and bracket indicate osteoprogenitors, osteocytes and unhealed area, respectively. Images are representatives of three independent experiments. Scale bar, 500 μm (af). Scale bar, 1 mm (h,k). Scale bar, 200 μm (i,l). Scale bar, 50 μm (j,ms).

References

    1. Chai Y. & Maxson R. E. Jr Recent advances in craniofacial morphogenesis. Dev. Dyn. 235, 2353–2375 (2006). - PubMed
    1. Mao J. J. & Prockop D. J. Stem cells in the face: tooth regeneration and beyond. Cell Stem Cell 11, 291–301 (2012). - PMC - PubMed
    1. Opperman L. A. Cranial sutures as intramembranous bone growth sites. Dev. Dyn. 219, 472–485 (2000). - PubMed
    1. Morriss-Kay G. M. & Wilkie A. O. Growth of the normal skull vault and its alteration in craniosynostosis: insights from human genetics and experimental studies. J. Anat. 207, 637–653 (2005). - PMC - PubMed
    1. Maruyama T., Mirando A. J., Deng C. X. & Hsu W. The balance of WNT and FGF signaling influences mesenchymal stem cell fate during skeletal development. Sci. Signal. 3, ra40 (2010). - PMC - PubMed

Publication types