. 2016 Feb 2:6:20287.
doi: 10.1038/srep20287.

Enhanced renoprotective effect of IGF-1 modified human umbilical cord-derived mesenchymal stem cells on gentamicin-induced acute kidney injury

Affiliations

Enhanced renoprotective effect of IGF-1 modified human umbilical cord-derived mesenchymal stem cells on gentamicin-induced acute kidney injury

Pengfei Liu et al. Sci Rep. .

Abstract

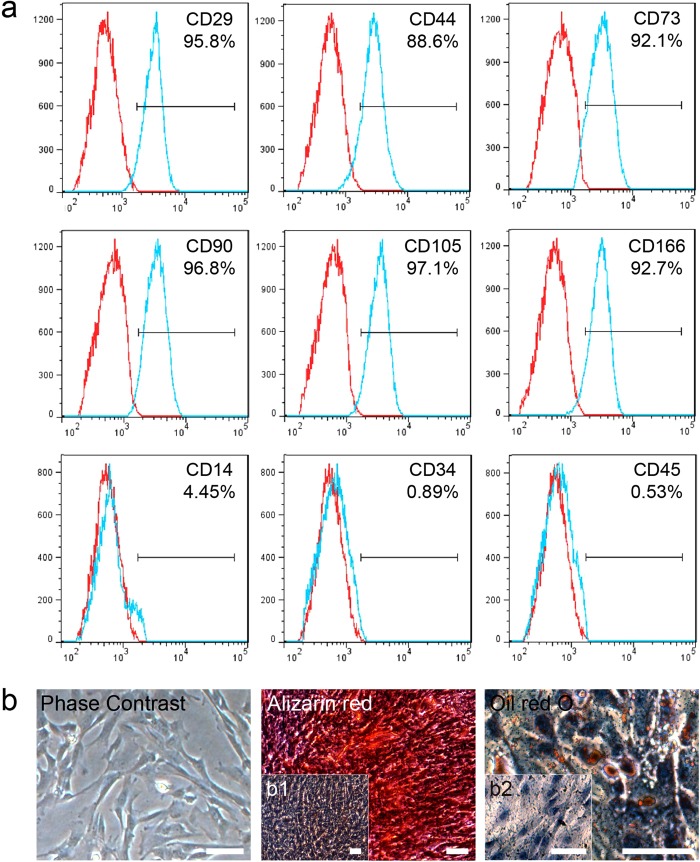
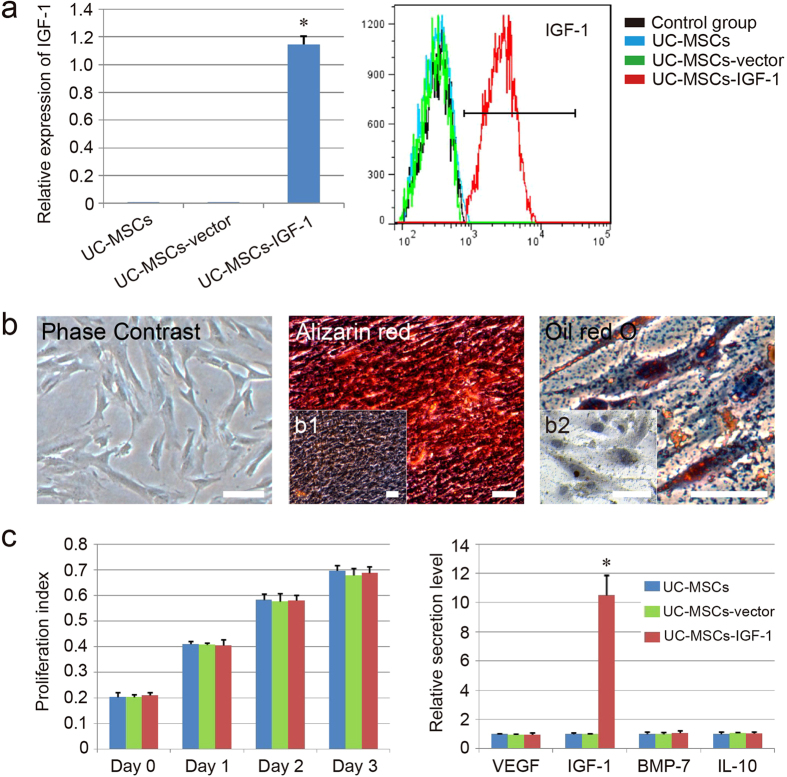
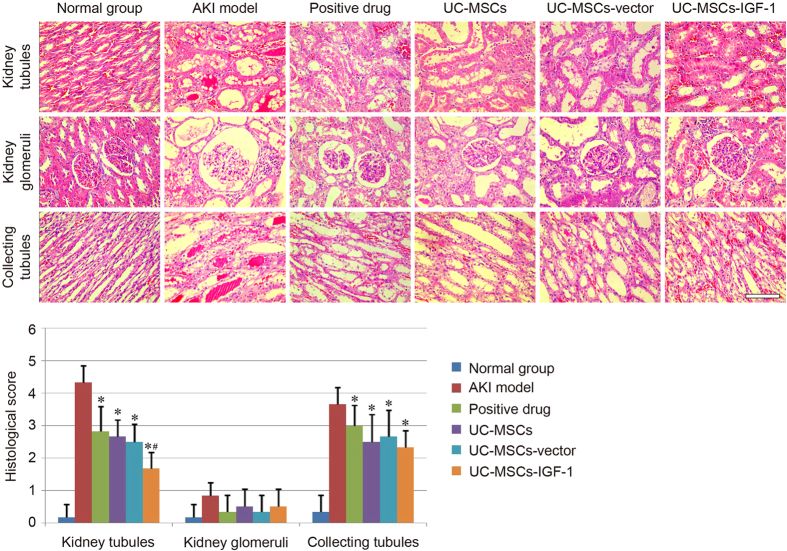
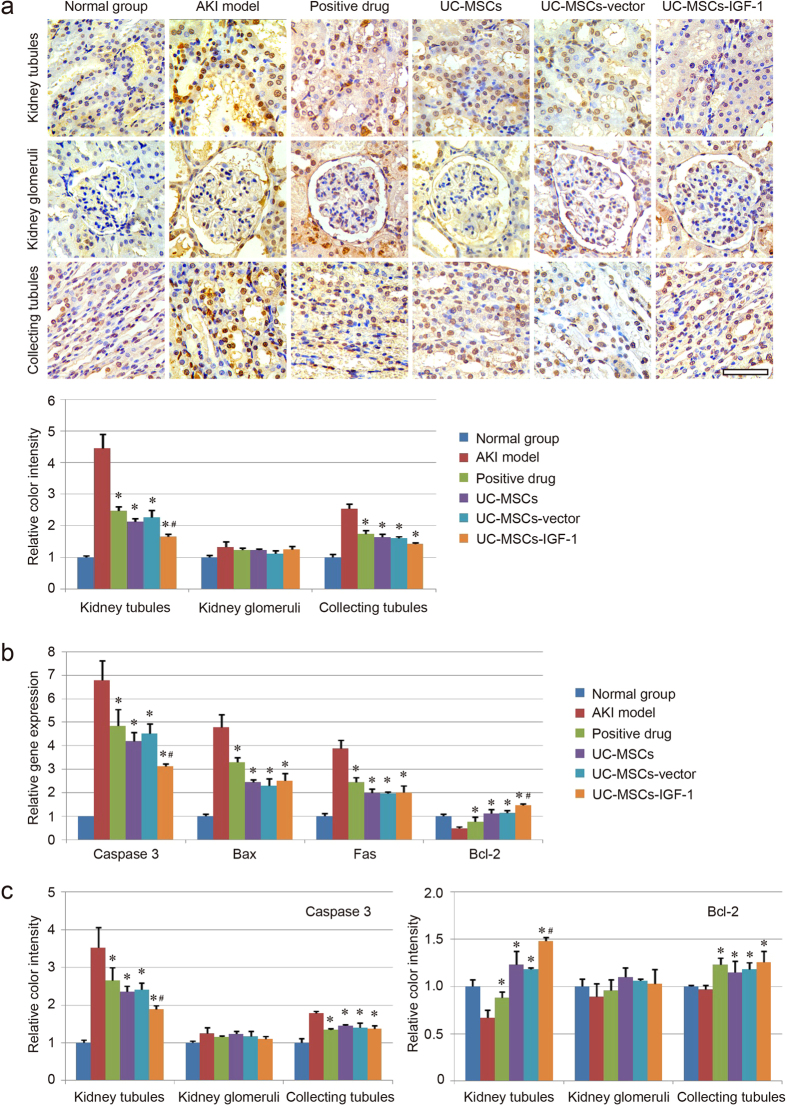
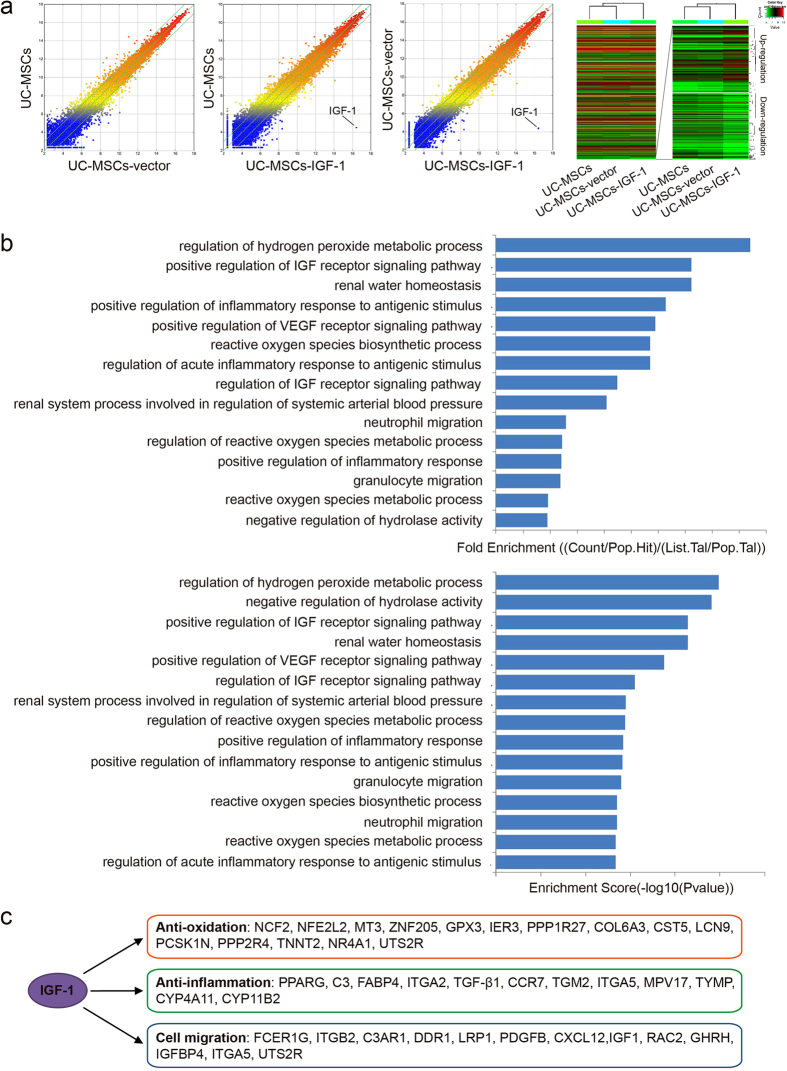
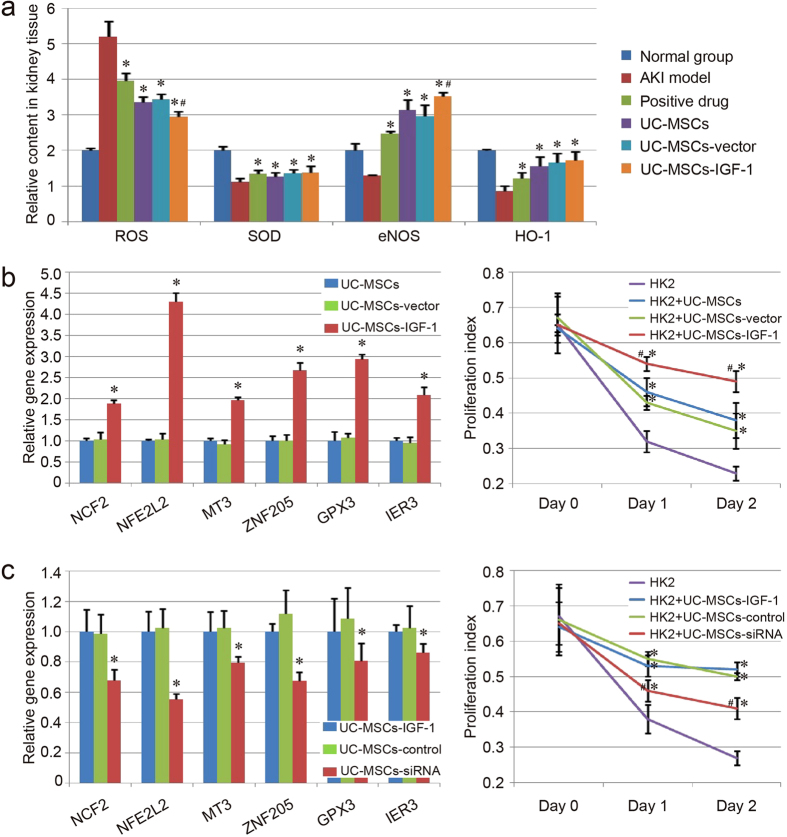
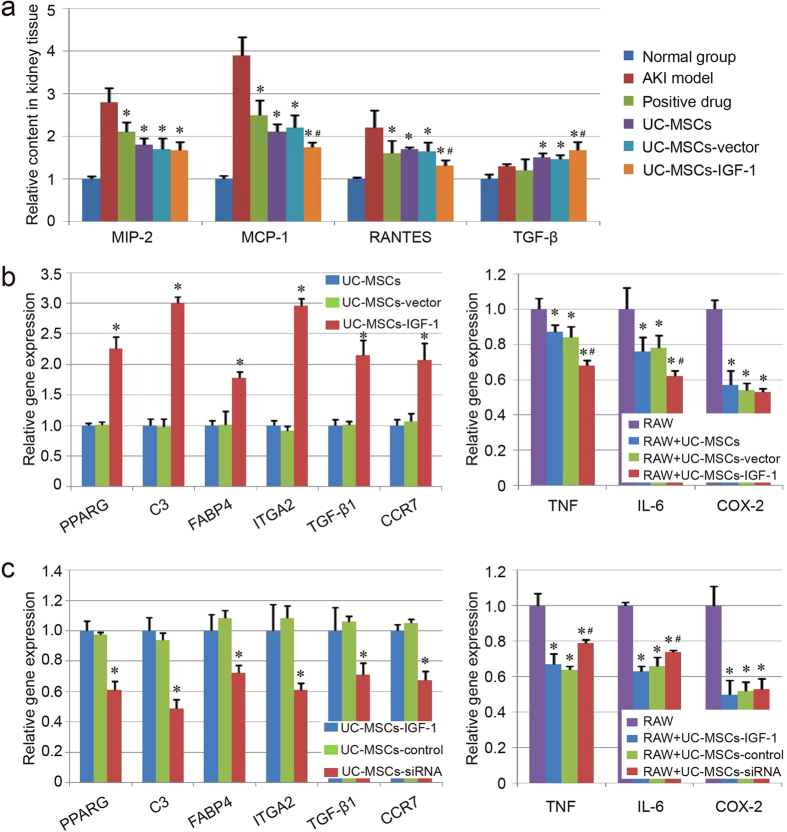
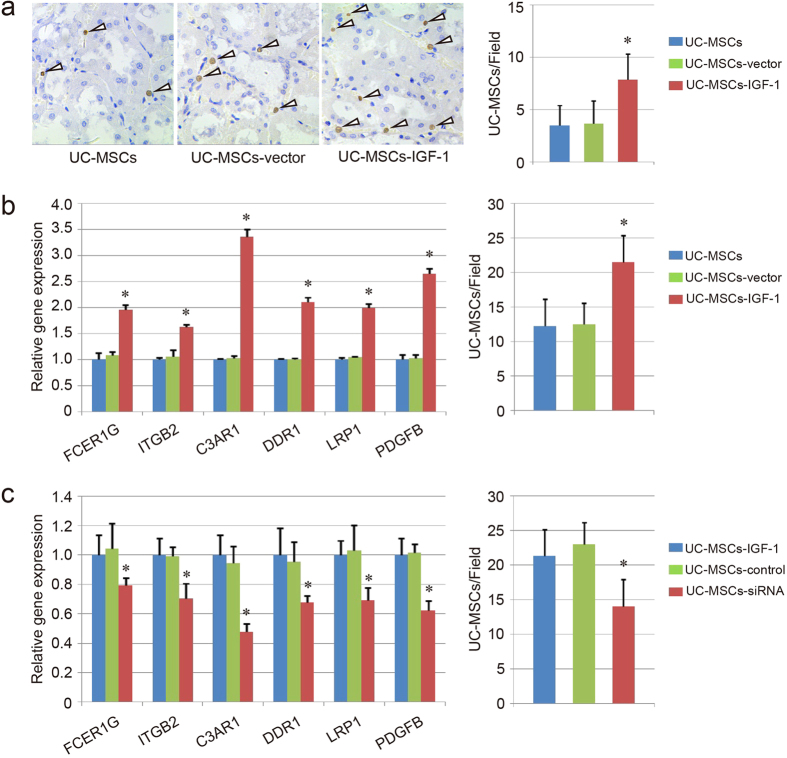
The therapeutic action of umbilical cord-derived mesenchymal stem cells (UC-MSCs) against acute kidney injury (AKI) has been demonstrated by several groups. However, how to further enhance the renoprotective effect of UC-MSCs and improve the therapy effect, are still unclear. In this study, we mainly investigated whether insulin-like growth factor-1 (IGF-1)-modified UC-MSCs hold an enhanced protective effect on gentamicin-induced AKI in vivo. Our results indicated that the IGF-1 overexpression could enhance the therapeutic action of human UC-MSCs, and the AKI rats treated with IGF-1-overexpressed UC-MSCs (UC-MSCs-IGF-1) showed better recovery of biochemical variables in serum or urine associated with renal function, histological injury and renal apoptosis, compared with AKI rats treated with normal UC-MSCs. RNA microarray analysis indicated that some key genes in the signal pathways associated with anti-oxidation, anti-inflammatory, and cell migratory capacity were up-regulated in UC-MSCs-IGF-1, and the results were further confirmed with qPCR. Furthermore, a series of detection in vitro and in vivo indicated that the UC-MSCs-IGF-1 hold better anti-oxidation, anti-inflammatory, and cell migratory capacity for IGF-1 overexpression. Thus, our study indicated that enhancement of UC-MSCs bioactivities with IGF-1 overexpression could increase the UC-MSCs therapeutic potential and further developed a new therapeutic strategy for the treatment of AKI.


Figures

Figure 1
Figure 1. Characterization of UC-MSCs.
(a) Immunophenotype of isolated UC-MSCs. Isolated UC-MSCs were characterized by FACS. UC-MSCs were positive for CD29, CD44, CD73, CD90, CD105, and CD166, and nearly negative for CD14, CD34, and CD45. (b) Differentiation characteristics of UC-MSCs. The phase contrast of UC-MSCs is shown on the left. Osteogenic differentiation was detected by Alizarin red staining (middle), and adipogenic differentiation was visualized by Oil Red O staining of the lipid vesicles (right). UC-MSCs cultured with normal medium were used as the negative control group for each stain (b1 and b2). All scale bars correspond to 100 μm.
Figure 2
Figure 2. Effects of IGF-1 overexpression on the biological function of UC-MSCs.
(a) Analysis of IGF-1 expression in different groups by qPCR (left) and FACS (right). (b) Differentiation characteristics of UC-MSCs-IGF-1. The phase contrast of UC-MSCs-IGF-1 is shown on the left. Osteogenic differentiation was detected by Alizarin red staining (middle), and adipogenic differentiation was visualized by Oil Red O staining of the lipid vesicles (right). UC-MSCs-IGF-1 cultured with normal medium were used as the negative control group for each stain (b1 and b2). All scale bars correspond to 100 μm. (c) Effect of IGF-1 overexpression on the cell proliferation and secretion. The secretion level of the normal group was regared as 1.0, and the relative secretion level of the other groups was evaluated. Results are expressed as mean ± SEM. A t-test was used to compare the various groups, and P < 0.05 was considered statistically significant. *P < 0.05 compared with the normal UC-MSCs and UC-MSCs-vector group respectively.
Figure 3
Figure 3. Detection of pathological changes in each group.
Pathological changes in the kidney tubules, kidney glomeruli, and collecting tubules were observed under a light microscope using H&E staining. Scale bar of the phase observed through H&E staining corresponds to 100 μm. Histological score of each group was also evaluated herein. Results are expressed as mean ± SEM. A t-test was used to compare the various groups. *P < 0.05 compared with the model group. #P < 0.05 compared with the normal UC-MSCs group and UC-MSCs-vector group respectively.
Figure 4
Figure 4. Evaluation of cell apoptosis in each group.
(a) Images of TUNEL staining in the kidney tubules, kidney glomeruli, and collecting tubules are shown for each group. The color intensity was measured using Motic Image Advanced 3.2. The color intensity of the normal group was regarded as 1.0, and the relative color intensity of the other groups was evaluated. (b) Detection of apoptotic genes (Caspase 3, Bax and Fas) and anti-apoptotic gene (Bcl-2) expression using qPCR. The gene expression level in the normal group was regarded as 1.0, and the relative gene expression level of each group was further evaluated. (c) Detection of Caspase 3 and Bcl-2 expression using immunohistochemistry. The color intensity was further measured using Motic Image Advanced 3.2. The color intensity of the normal group was regarded as 1.0, and the relative color intensity of the other groups was further evaluated. Results are expressed as mean ± SEM. A t-test was used to compare the various groups, and P < 0.05 was considered statistically significant. *P < 0.05 compared with the model group; #P < 0.05 compared with the normal UC-MSCs group and UC-MSCs-vector group respectively. Scale bar corresponds to 50 μm.
Figure 5
Figure 5. RNA microarray analysis of UC-MSCs, UC-MSCs-vector and UC-MSCs-IGF-1.
(a) Comparison of global gene expression profiles of UC-MSCs, UC-MSCs-vector and UC-MSCs-IGF-1. The values of X and Y axes in the Scatter-Plot were normalized signal values of each sample (log2 scaled). The green lines are Fold Change Lines (The default fold change value given was 2.0). Over two fold alterations of genes between two compared samples could be found above the top green line and below the bottom green line. In Hierarchical Clustering for “all targets value”, “Red” indicates high relative expression, and “green” indicates low relative expression. The heatmap of all detected genes was shown on the left, and the heatmap of the up-regulated or down-regulated genes in UC-MSCs-IGF-1 was shown on the right. (b) Analysis of Gene Ontology project associated with cell migration, anti-oxidation capacity, and anti-inflammatory capacity. The bar plots showed the Fold Enrichment and Enrichment Score value of the significant enrichment terms. (c) Genes connected to IGF-1 overexpression through bio-informatics prediction.
Figure 6
Figure 6. Evaluation of anti-oxidation capacity of UC-MSCs, UC-MSCs-vector and UC-MSCs-IGF-1.
(a) Relative contents of ROS and some antioxidants (SOD, eNOS and HO-1) in injured kidney tissues of each group. The contents of ROS and those antioxidants in the normal group were regarded as 1.0, and the relative contents of the other groups were further evaluated. Results are expressed as mean ± SEM. A t-test was used to compare the various groups, and P < 0.05 was considered statistically significant. *P < 0.05 compared with the model group; #P < 0.05 compared with the normal UC-MSCs group and UC-MSCs-vector group respectively. (b) Evaluation of anti-oxidation capacity of UC-MSCs, UC-MSCs-vector and UC-MSCs-IGF-1 in vitro. Expression of the genes about anti-oxidation function (NCF2, NLE2L2, MT3, ZNF205, GPX3 and IER3) was detected with qPCR. The level of gene expression in UC-MSCs was regarded as 1.0. *P < 0.05 compared with the normal UC-MSCs group and UC-MSCs-vector group respectively. The co-culture system was established with HK-2 cells and UC-MSCs (blue line)/UC-MSCs-vector (green line) /UC-MSCs-IGF-1 (red line). The proliferation index of each co-culture group exposed to 30 μM H2O2 was determined with CCK-8. *P < 0.05 compared with the control group; #P < 0.05 compared with the normal UC-MSCs group and UC-MSCs-vector group respectively. (c) Effect of IGF-1-siRNA on the anti-oxidation function of UC-MSCs-IGF-1. Expression of NCF2, NLE2L2, MT3, ZNF205, GPX3 and IER3 was further detected with qPCR in UC-MSCs-IGF-1, UC-MSCs-control and UC-MSCs-siRNA. The level of gene expression in UC-MSCs-IGF-1 was regarded as 1.0. The co-culture system was also established with HK-2 cells and those stem cells (UC-MSCs-IGF-1: blue line, UC-MSCs-control: green line, UC-MSCs-siRNA: red line), and the proliferation index of each co-culture group exposed to 30 μM H2O2 was determined as before.
Figure 7
Figure 7. Evaluation of anti-inflammatory capacity of UC-MSCs, UC-MSCs-vector and UC-MSCs-IGF-1.
(a) Detection of inflammatory component using ELISA. The contents of the inflammatory components in the normal group were regarded as 1.0, and the relative contents of the other groups were further evaluated. Results are expressed as mean ± SEM. A t-test was used to compare the various groups, and P < 0.05 was considered statistically significant. *P < 0.05 compared with the model group; #P < 0.05 compared with the normal UC-MSCs group and UC-MSCs-vector group respectively. (b) Evaluation of anti-inflammatory capacity of UC-MSCs, UC-MSCs-vector and UC-MSCs-IGF-1 in vitro. Expression of the genes about anti-inflammatory capacity (PPARG, C3, FABP4, ITGA2, TGF-β1 and CCR7) was detected with qPCR. The level of gene expression in UC-MSCs was regarded as 1.0. *P < 0.05 compared with the normal UC-MSCs group and UC-MSCs-vector group respectively. The co-culture system was established with RAW264.7 cells (RAW) and UC-MSCs/UC-MSCs-vector/UC-MSCs-IGF-1. The expression of genes associated with inflammatory response (TNF, IL-6 and COX-2) was determined with qPCR. *P < 0.05 compared with the control group; #P < 0.05 compared with the normal UC-MSCs group and UC-MSCs-vector group respectively. (c) Effect of IGF-1-siRNA on the anti-inflammatory capacity of UC-MSCs-IGF-1. Expression of PPARG, C3, FABP4, ITGA2, TGF-β1 and CCR7 was further detected with qPCR in UC-MSCs-IGF-1, UC-MSCs-control and UC-MSCs-siRNA. The level of gene expression in UC-MSCs-IGF-1 was regarded as 1.0. The co-culture system was also established with RAW264.7 cells and those stem cells, and expression of TNF, IL-6 and COX-2, was determined with qPCR as before.
Figure 8
Figure 8. Evaluation of migratory capacity of UC-MSCs, UC-MSCs-vector and UC-MSCs-IGF-1.
(a) Migratory capacity of UC-MSCs, UC-MSCs-vector and UC-MSCs-IGF-1 in vivo. Representative images of hNA-positive cells in the UC-MSCs group, UC-MSCs-vector group and UC-MSCs-IGF-1 group. The number of BrdU-positive cells was further counted in each field. (b) Evaluation of migratory capacity of UC-MSCs, UC-MSCs-vector and UC-MSCs-IGF-1 in vitro. Expression of the genes about migratory capacity (FCER1G, ITGB2, C3AR1, DDR1, LRP1 and PDGFB) was detected with qPCR. The level of gene expression in UC-MSCs was regarded as 1.0. The cell migratory capacity was further evaluated using transfilter assay. The number of migrating cells was counted in each field. *P < 0.05 compared with the normal UC-MSCs group and UC-MSCs-vector group respectively. (c) Effect of IGF-1-siRNA on the migratory capacity of UC-MSCs-IGF-1. Expression of FCER1G, ITGB2, C3AR1, DDR1, LRP1 and PDGFB was further detected with qPCR in UC-MSCs-IGF-1, UC-MSCs-control, UC-MSCs-siRNA. The level of gene expression in UC-MSCs-IGF-1 was regarded as 1.0. The transfilter assay was also performed to determine the cell migratory capacity as before.

Similar articles

Cited by

References

    1. Bellomo R., Kellum J. A. & Ronco C. Acute kidney injury. Lancet 380, 756–766 (2012). - PubMed
    1. Thadhani R., Pascual M. & Bonventre J. V. Acute renal failure. New Engl J Med 334, 1448–1460 (1996). - PubMed
    1. Fang T. C., Pang C. Y., Chiu S. C., Ding D. C. & Tsai R. K. Renoprotective effect of human umbilical cord-derived mesenchymal stem cells in immunodeficient mice suffering from acute kidney injury. PloS one 7, e46504 (2012). - PMC - PubMed
    1. Anathhanam S. & Lewington A. J. Acute kidney injury. J Roy Coll Phys Lond 43, 323–329 (2013). - PubMed
    1. Wang W. W. et al.. Enhanced renoprotective effect of HIF-1alpha modified human adipose-derived stem cells on cisplatin-induced acute kidney injury in vivo. Sci Rep 5, 10851 (2015). - PMC - PubMed

Publication types

MeSH terms