. 2016 Apr;57(4):729-42.
doi: 10.1194/jlr.D065664. Epub 2016 Feb 1.

Novel flow cytometric approach for the detection of adipocyte subpopulations during adipogenesis

Affiliations

Novel flow cytometric approach for the detection of adipocyte subpopulations during adipogenesis

Chrisna Durandt et al. J Lipid Res. 2016 Apr.

Abstract

The ability of mesenchymal stromal cells (MSCs) to differentiate into adipocytes provides a cellular model of human origin to study adipogenesis in vitro. One of the major challenges in studying adipogenesis is the lack of tools to identify and monitor the differentiation of various subpopulations within the heterogeneous pool of MSCs. Cluster of differentiation (CD)36 plays an important role in the formation of intracellular lipid droplets, a key characteristic of adipocyte differentiation/maturation. The objective of this study was to develop a reproducible quantitative method to study adipocyte differentiation by comparing two lipophilic dyes [Nile Red (NR) and Bodipy 493/503] in combination with CD36 surface marker staining. We identified a subpopulation of adipose-derived stromal cells that express CD36 at intermediate/high levels and show that combining CD36 cell surface staining with neutral lipid-specific staining allows us to monitor differentiation of adipose-derived stromal cells that express CD36(intermediate/high)during adipocyte differentiation in vitro. The gradual increase of CD36(intermediate/high/)NR(positive)cells during the 21 day adipogenesis induction period correlated with upregulation of adipogenesis-associated gene expression.

Keywords: Bodipy 493/503; Nile Red; adipocyte differentiation; adipose tissue-derived stromal cells; cluster of differentiation 36; fatty/acid binding protein; gene expression; lipid droplet; triglyceride.


Figures

Fig. 1.
Fig. 1.
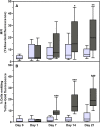
MFI (A) as well as percentage (B) of intact cells that emit yellow-gold fluorescence (515–565 nm) after staining with NR. Cultures were terminated on days 0 (n = 10), 1 (n = 9), 7 (n = 13), 14 (n = 13), and 21 (n = 13) after induction of adipogenesis. Results are displayed as minimum/maximum box-whisker plots where the median value is indicated by the solid horizontal line within each box. ASC cultures were from 10 different donors. Results from noninduced cultures are indicated by light gray box-whisker boxes; results from differentiated cells (adipocytes) are indicated by dark gray boxes. *P < 0.5; **P < 0.01; ***P < 0.001.
Fig. 2.
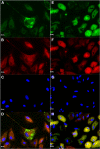
Fig. 2.
Fluorescence microscopy images of noninduced ASCs (A, C) and differentiated adipocytes (B, D) after staining with NR (A, B) and BDP (C, D). DAPI was used to visualize the nuclei. Images were obtained 21 days post induction. Images were initially captured as single channel images and then merged using Image J software.
Fig. 3.
Fig. 3.
A comparison of NR and BDP detection of lipid droplets in ASC cultures from seven independent donors. Cultures were terminated on days 0, 1, 7, 14, and 21 after induction of adipogenesis. A: Percentage of intact cells that emit yellow-gold fluorescence (515–565 nm) after staining with NR. B: Percentage of intact cells that emit green fluorescence (515–535 nm) after staining with BDP. The positive detection limits were set according to auto-fluorescence levels detected at day 0. Results are displayed as minimum/maximum box-whisker plots where the median value is indicated by the solid horizontal line within each box. Results from noninduced cultures are indicated by light gray box-whisker boxes; results from differentiated cells (adipocytes) are indicated by dark gray boxes. Asterisks (*) indicate statistical significance at the specific time point when compared with the same culture condition at day 1. *P < 0.5; **P < 0.01; ***P < 0.001.
Fig. 4.
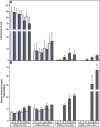
Fig. 4.
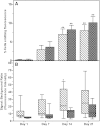
Comparison of intracellular neutral lipid accumulation after staining with NR and BDP, respectively, in ASCs induced to differentiate into adipocytes. A: Percentage of intact cells from induced cultures that emit neutral lipid-specific fluorescence. Results are expressed as mean percent of cells emitting lipid-specific fluorescence ± SD. B: The signal (emitted fluorescence):background fluorescence ratio after staining with NR and BDP. Signal:background ratio results are displayed as minimum/maximum box-whisker plots where the median value is indicated by the solid horizontal line within each box. The positive detection limits (region) were adjusted to compensate for the noninduced associated changes in fluorescence. The bars with diagonal fill indicate the results (corrected) obtained for cultures stained with NR. The bars with checker box fill indicate the results (corrected) obtained for cultures stained with BDP. Asterisks (*) indicate statistical significance at the specific time point when compared with the same staining condition at day 1. *P < 0.5; **P < 0.01.
Fig. 5.
Fig. 5.
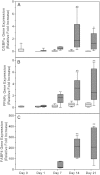
Levels of expression of genes associated with adipocyte differentiation. C/EBPα (A); PPARγ (B); FABP4 (C). Cultures were terminated on days 0, 1, 7, 14, and 21, respectively, after induction of adipogenesis. Relative fold-increase in gene expression (ΔCT) was reported as fold-increase of gene expression relative to the following housekeeping genes: GUSB, PPIA, TBP, and YWHAZ. All results are expressed as mean ± SD from six ASC cultures. Noninduced cultures are indicated by light gray bars; differentiated cells (adipocytes) are indicated by dark gray bars. *P < 0.5; **P < 0.01.
Fig. 6.
Fig. 6.
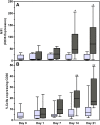
Percentage of intact cells that express CD36 at intermediate/high levels. Cultures were terminated on days 0, 1, 7, 14, and 21 after induction of adipogenesis. Results are displayed as minimum/maximum box-whisker plots where the median value is indicated by the solid horizontal line within each box. ASC cultures were from nine different donors. A: MFI of CD36intermediate/high-expressing cells. B: Percentage of cells with intermediate/high CD36 expression. Results represent nine ASC cultures. Results from noninduced cultures are indicated by light gray bars; results from differentiated cells (adipocytes) are indicated dark gray bars. *P < 0.5; **P < 0.01.
Fig. 7.
Fig. 7.
An increase in the surface expression of CD36 precedes an increase in intracellular neutral lipid content during adipocyte differentiation. Results are expressed as percent of intact cells emitting both neutral lipid-specific stain and CD36-associated fluorescence. Results represent the mean ± SD of eight independent donors’ ASC cultures. Cultures were simultaneously stained with mouse anti-human CD36-APC, as well as a lipid-specific fluorescent dye. A: Noninduced cells stained with CD36-APC and NR. B: Induced cells stained with CD36-APC and NR. C: Noninduced cells stained with CD36-APC and BDP. D: Induced cells stained with CD36-APC and BDP. Asterisks (*) indicate statistical significance at the specific time point when compared with the same subpopulation at day 1. *P < 0.5; *** P < 0.001.
Fig. 8.
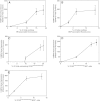
Fig. 8.
Correlation between FABP4 mRNA expression and mature adipocyte phenotypes as identified using flow cytometry. Correlation of FABP4 gene expression with an increase in intracellular neutral lipid content (total) after staining with NR (A); an increase in intracellular neutral lipid content (total) after staining with BDP (B); an increase in the intermediate/high expression levels of CD36 (C); the proportion of cells that highly express CD36 and simultaneously emitted yellow-gold fluorescence (NR-associated) (D); and proportion of cells that highly express CD36 and simultaneously emit green fluorescence after staining with BDP (E). Cultures were terminated on days 0, 1, 7, 14, and 21 after induction of adipogenesis. Gene expression levels were normalized to day 0. All results are expressed as mean ± SD and are from five independent ASC cultures from five different donors.
Fig. 9.
Fig. 9.
Fluorescence microscope images of ASCs at 7 days (A–D) and 21 days (E–H) after induction of adipogenesis. Cells were simultaneously stained with DAPI and NR. Images were captured as single channel images. Yellow-gold fluorescence lipid droplets were visualized using an excitation of 450–490 nm and an emission of 515–565 nm (A, E). Lipid droplets emitting deep-red fluorescence were visualized using an excitation of 530–585 nm and an emission of >615 nm (B, F). Nuclei were visualized using an excitation of 365 and an emission of 425–465 nm (C, G). Single channel images were merged using Image J software (D, H).
Fig. 10.
Fig. 10.
Maturation of adipocytes in vitro is associated with an increase in cellular complexity. Cells were stained with CD36 APC and NR. A: Percent expression. Results are expressed as the mean percent expression ± SD of three ASC cultures over a 21 day period. Noninduced cultures are indicated by light gray bars; differentiated cells (adipocytes) are indicated by dark gray bars. **P < 0.01.

Similar articles

Cited by

References

    1. Mosna F., Sensebé L., and Krampera M.. 2010. Human bone marrow and adipose tissue mesenchymal stem cells: a user’s guide. Stem Cells Dev. 19: 1449–1470. - PubMed
    1. Myers T. J., Granero-Molto F., Longobardi L., Li T., Yan Y., and Spagnoli A.. 2010. Mesenchymal stem cells at the intersection of cell and gene therapy. Expert Opin. Biol. Ther. 10: 1663–1679. - PMC - PubMed
    1. Bourin P., Bunnell B. A., Casteilla L., Dominici M., Katz A. J., March K. L., Redl H., Rubin J. P., Yoshimura K., and Gimble J. M.. 2013. Stromal cells from the adipose tissue-derived stromal vascular fraction and culture expanded adipose tissue-derived stromal/stem cells: a joint statement of the International Federation for Adipose Therapeutics and Science (IFATS) and the International Society for Cellular Therapy (ISCT). Cytotherapy. 15: 641–648. - PMC - PubMed
    1. Ren G., Chen X., Dong F., Li W., Ren X., Zhang Y., and Shi Y.. 2012. Concise review: mesenchymal stem cells and translational medicine: emerging issues. Stem Cells Transl. Med. 1: 51–58. - PMC - PubMed
    1. Vishnubalaji R., Al-Nbaheen M., Kadalmani B., Aldahmash A., and Ramesh T.. 2012. Comparative investigation of the differentiation capability of bone-marrow- and adipose-derived mesenchymal stem cells by qualitative and quantitative analysis. Cell Tissue Res. 347: 419–427. - PubMed

Publication types

LinkOut - more resources