

Microbial profiles at baseline and not the use of antibiotics determine the clinical outcome of the treatment of chronic periodontitis
- PMID: 26830979
- PMCID: PMC4735321
- DOI: 10.1038/srep20205
Microbial profiles at baseline and not the use of antibiotics determine the clinical outcome of the treatment of chronic periodontitis
Abstract
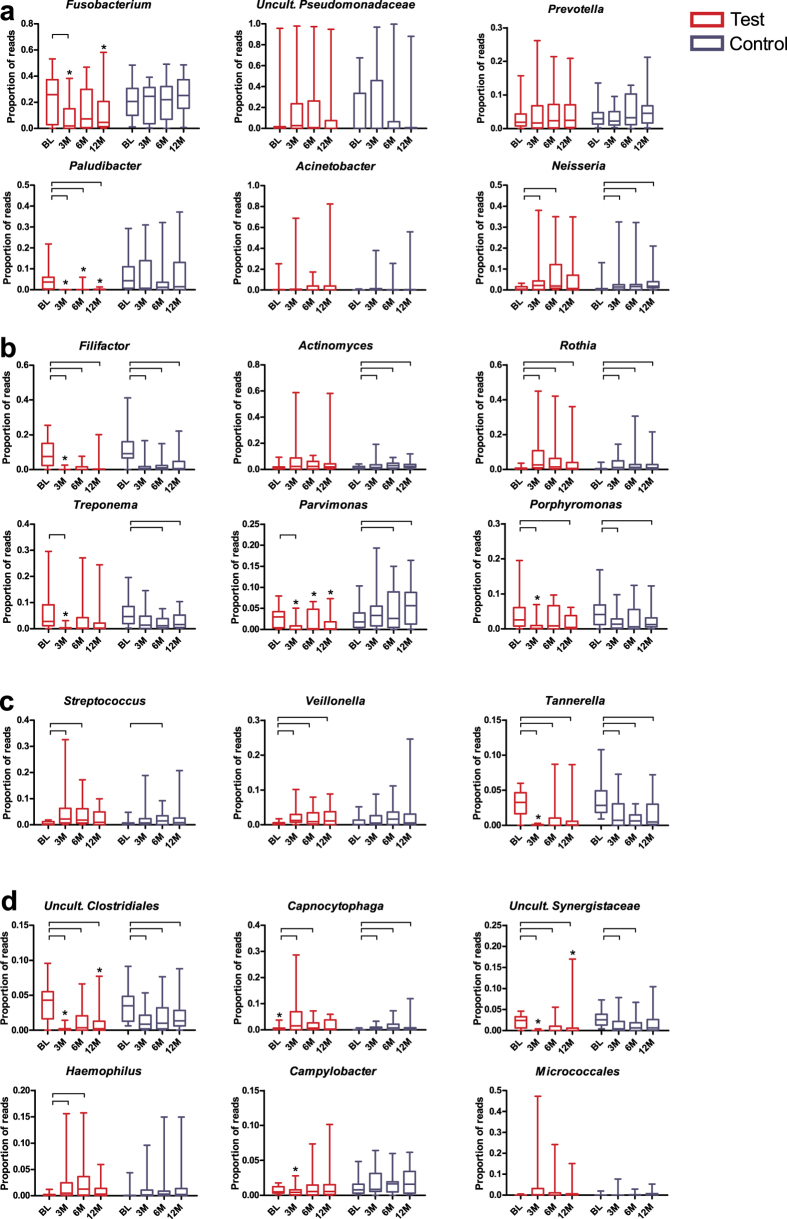
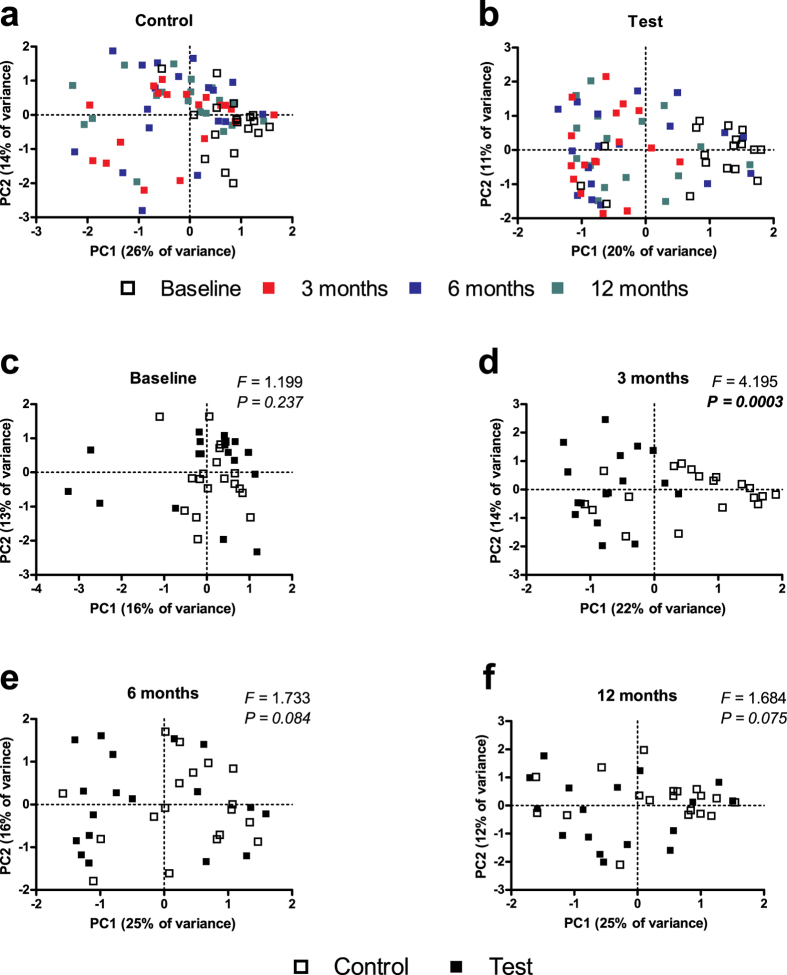
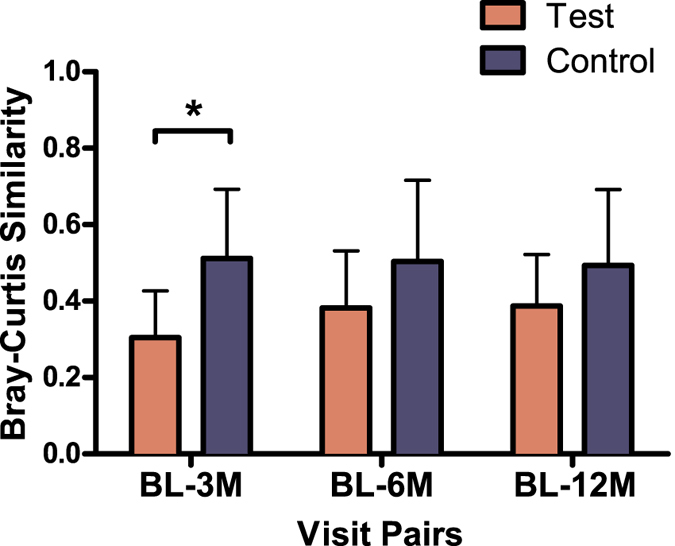
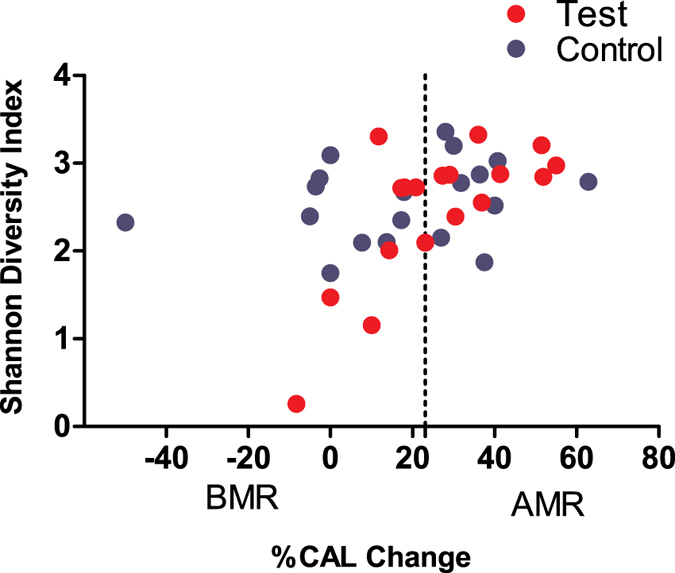
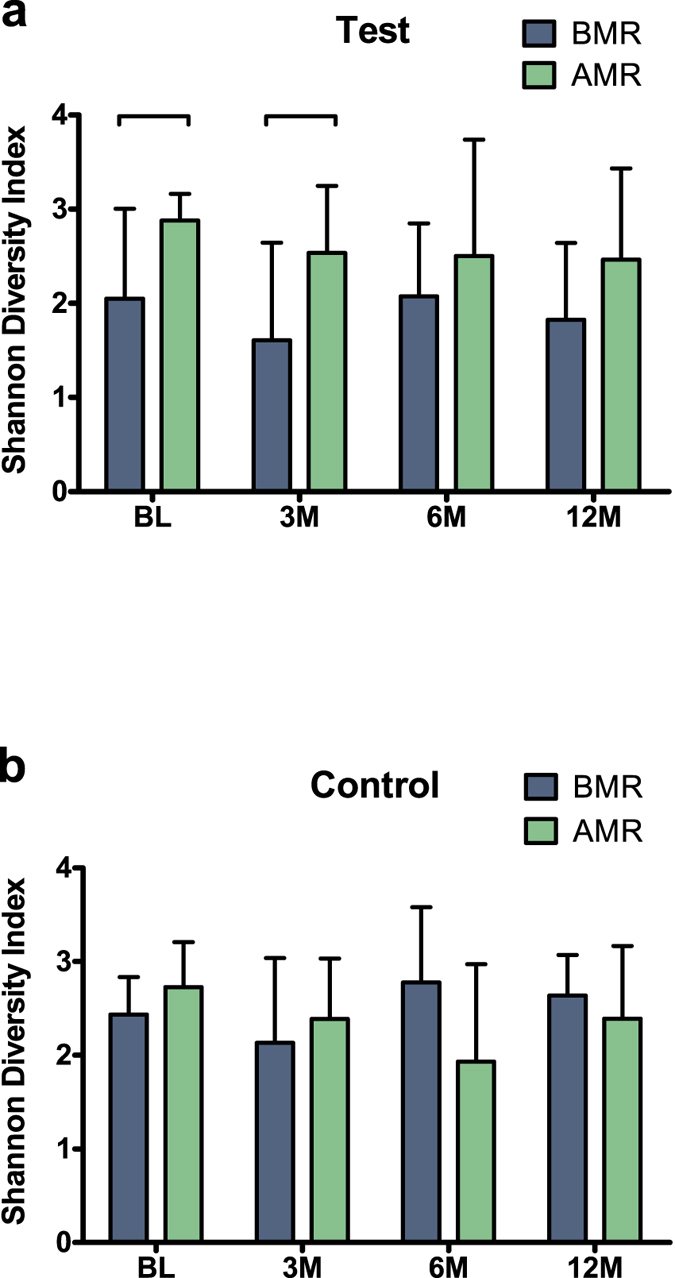
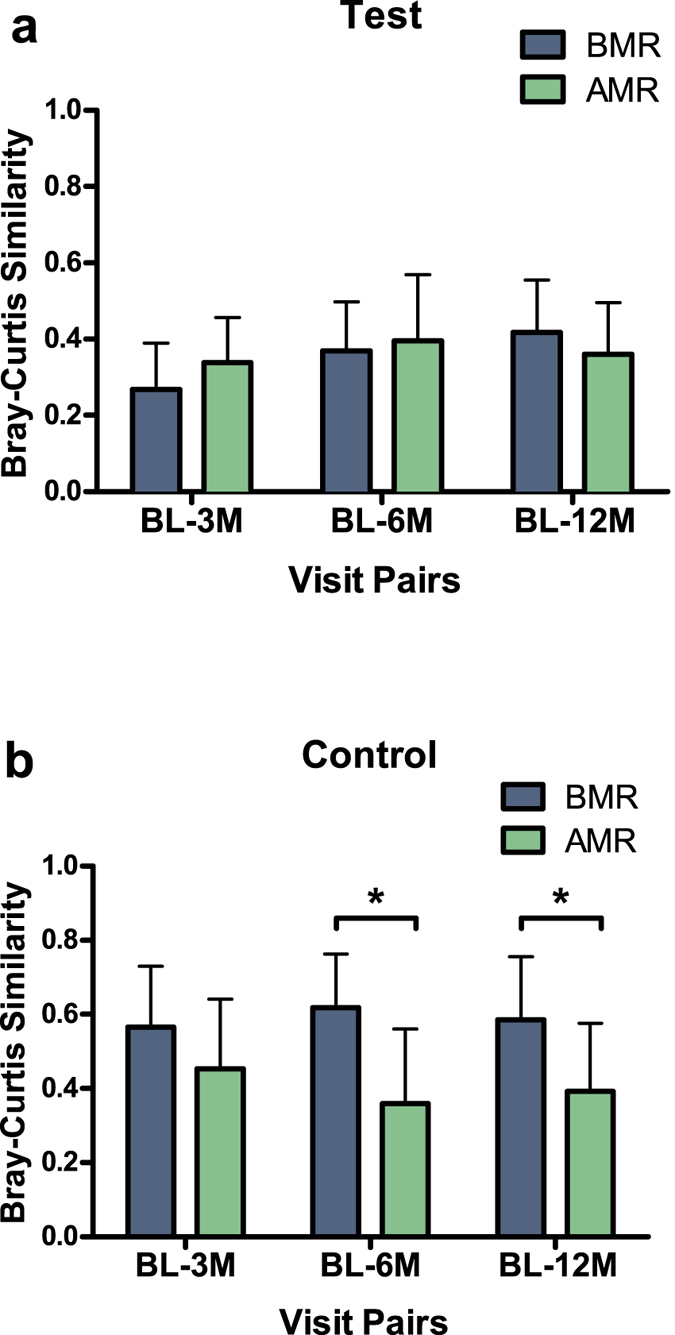
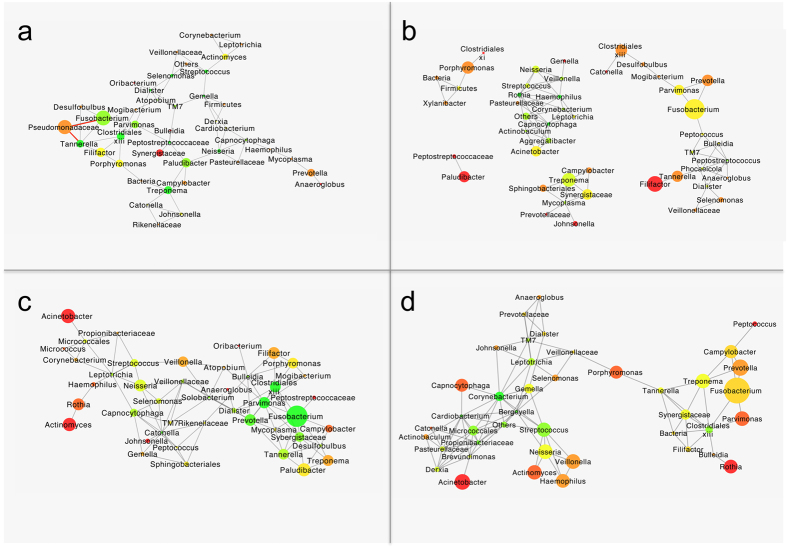
Antibiotics are often used in the treatment of chronic periodontitis, which is a major cause of tooth loss. However, evidence in favour of a microbial indication for the prescription of antibiotics is lacking, which may increase the risk of the possible indiscriminate use of antibiotics, and consequent, microbial resistance. Here, using an open-ended technique, we report the changes in the subgingival microbiome up to one year post-treatment of patients treated with basic periodontal therapy with or without antibiotics. Antibiotics resulted in a greater influence on the microbiome 3 months after therapy, but this difference disappeared at 6 months. Greater microbial diversity, specific taxa and certain microbial co-occurrences at baseline and not the use of antibiotics predicted better clinical treatment outcomes. Our results demonstrate the predictive value of specific subgingival bacterial profiles for the decision to prescribe antibiotics in the treatment of periodontitis, but they also indicate the need for alternative therapies based on ecological approaches.
Figures
Similar articles
-
Do we treat our patients or rather periodontal microbes with adjunctive antibiotics in periodontal therapy? A 16S rDNA microbial community analysis.PLoS One. 2018 Apr 18;13(4):e0195534. doi: 10.1371/journal.pone.0195534. eCollection 2018. PLoS One. 2018. PMID: 29668720 Free PMC article. Clinical Trial.
-
Moxifloxacin as an adjunctive antibiotic in the treatment of severe chronic periodontitis.J Periodontol. 2008 Oct;79(10):1894-903. doi: 10.1902/jop.2008.070493. J Periodontol. 2008. PMID: 18834244 Clinical Trial.
-
Antibiotics in the treatment of periodontal diseases: microbiological basis and clinical applications.Ann R Australas Coll Dent Surg. 2008 Jun;19:37-44. Ann R Australas Coll Dent Surg. 2008. PMID: 19728628 Review.
-
[Comparative characteristics of oral microbiocenosis in patients with chronic generalized and aggressive periodontitis before and after treatment].Stomatologiia (Mosk). 2012;91(6):28-32. Stomatologiia (Mosk). 2012. PMID: 23268214 Russian.
-
Should Antibiotics Be Prescribed to Treat Chronic Periodontitis?Dent Clin North Am. 2015 Oct;59(4):919-33. doi: 10.1016/j.cden.2015.06.011. Epub 2015 Aug 1. Dent Clin North Am. 2015. PMID: 26427574 Free PMC article. Review.
Cited by
-
Submucosal microbiome of peri-implant sites: A cross-sectional study.J Clin Periodontol. 2021 Sep;48(9):1228-1239. doi: 10.1111/jcpe.13502. Epub 2021 Jul 14. J Clin Periodontol. 2021. PMID: 34101220 Free PMC article.
-
Citizen-science based study of the oral microbiome in Cystic fibrosis and matched controls reveals major differences in diversity and abundance of bacterial and fungal species.J Oral Microbiol. 2021 May 17;13(1):1897328. doi: 10.1080/20002297.2021.1897328. J Oral Microbiol. 2021. PMID: 34104346 Free PMC article.
-
Microcosm biofilms cultured from different oral niches in periodontitis patients.J Oral Microbiol. 2018 Nov 27;11(1):1551596. doi: 10.1080/20022727.2018.1551596. eCollection 2019. J Oral Microbiol. 2018. PMID: 30598734 Free PMC article.
-
Metabolic changes during periodontitis therapy assessed by real-time ambient mass spectrometry.Clin Mass Spectrom. 2019 Jan 24;14 Pt A:54-62. doi: 10.1016/j.clinms.2019.01.001. eCollection 2019 Sep. Clin Mass Spectrom. 2019. PMID: 34917761 Free PMC article.
-
Inferring early-life host and microbiome functions by mass spectrometry-based metaproteomics and metabolomics.Comput Struct Biotechnol J. 2021 Dec 20;20:274-286. doi: 10.1016/j.csbj.2021.12.012. eCollection 2022. Comput Struct Biotechnol J. 2021. PMID: 35024099 Free PMC article. Review.
References
-
- Jin L. J., Armitage G. C., Klinge B., Lang N. P., Tonetti M. & Williams R. C. Global oral health inequalities: task group—periodontal disease. Adv Dent Res 23, 221–226 (2011). - PubMed
-
- Pihlstrom B. L., Michalowicz B. S. & Johnson N. W. Periodontal diseases. Lancet 366, 1809–1820 (2005). - PubMed
-
- Armitage G. C. Development of a classification system for periodontal diseases and conditions. Ann Periodontol 4, 1–6 (1999). - PubMed
-
- Albandar J. M. Aggressive periodontitis: case definition and diagnostic criteria. Periodontol 2000 65, 13–26 (2014). - PubMed
-
- Susin C., Haas A. N. & Albandar J. M. Epidemiology and demographics of aggressive periodontitis. Periodontol 2000 65, 27–45 (2014). - PubMed
Publication types
MeSH terms
Substances
LinkOut - more resources
Full Text Sources
Other Literature Sources
Medical
