. 2016 Mar 8;113(10):2726-31.
doi: 10.1073/pnas.1521238113. Epub 2016 Feb 1.

In vivo imaging identifies temporal signature of D1 and D2 medium spiny neurons in cocaine reward

Affiliations

In vivo imaging identifies temporal signature of D1 and D2 medium spiny neurons in cocaine reward

Erin S Calipari et al. Proc Natl Acad Sci U S A. .

Abstract

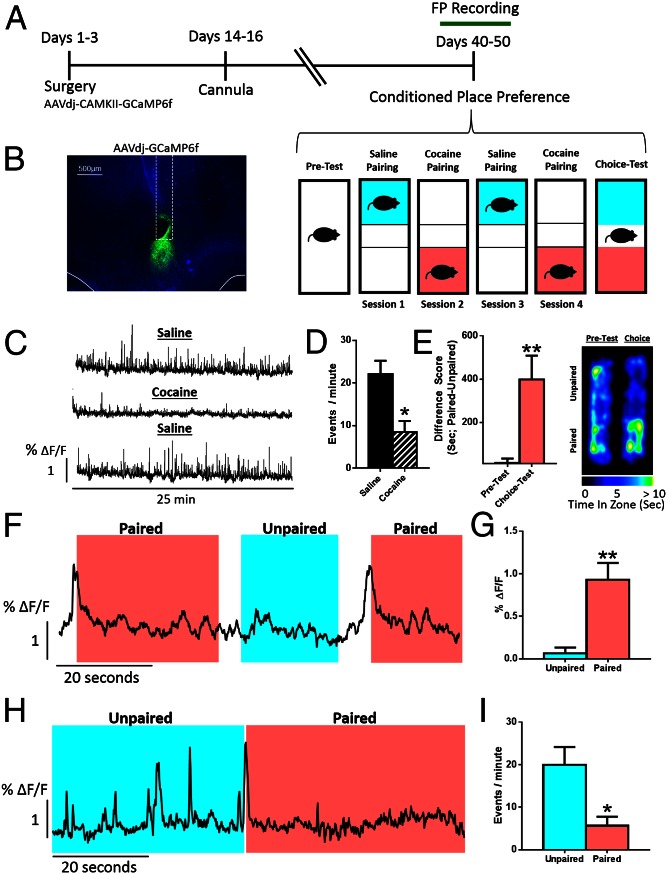
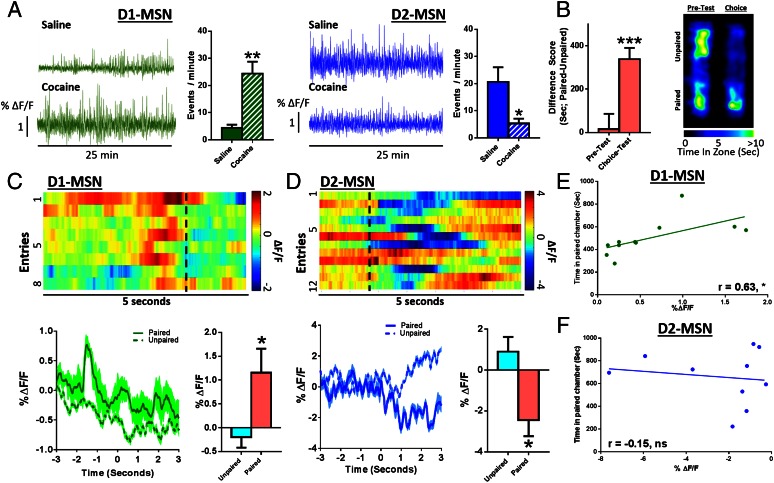
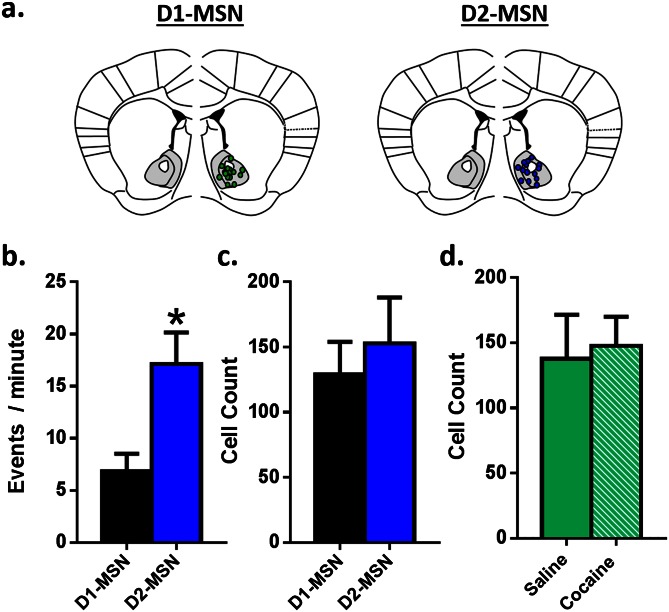
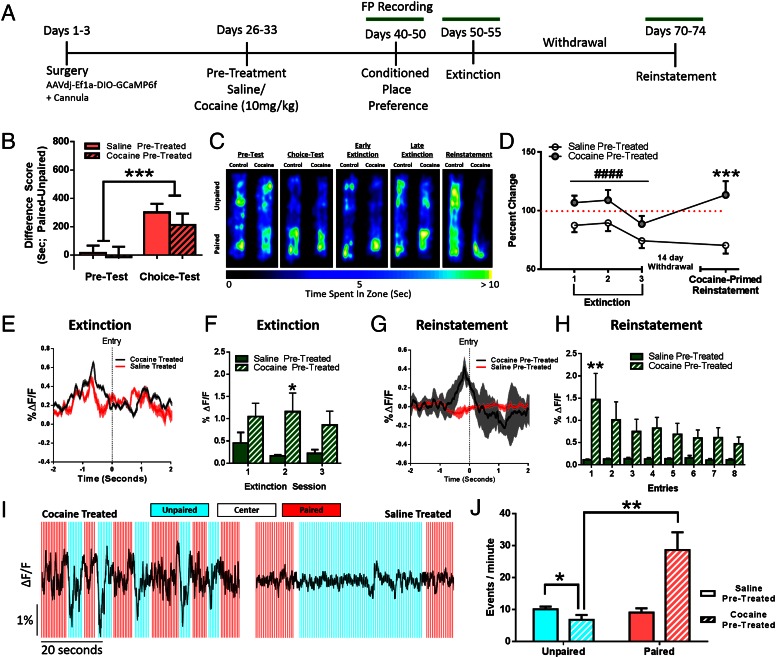
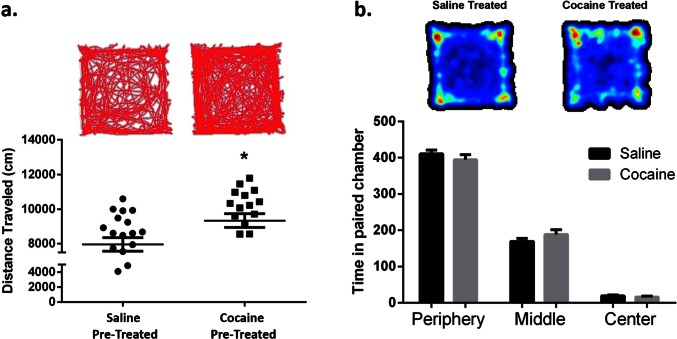
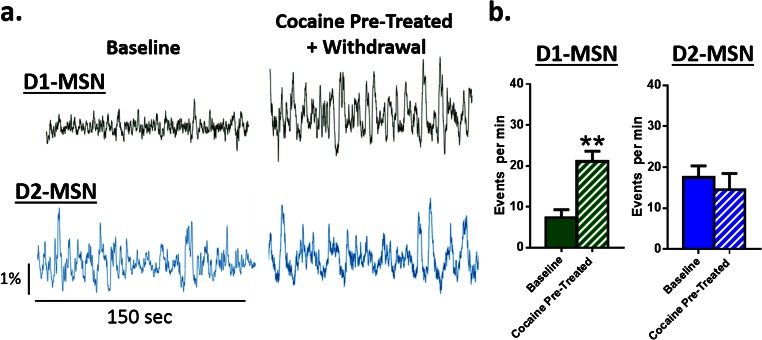
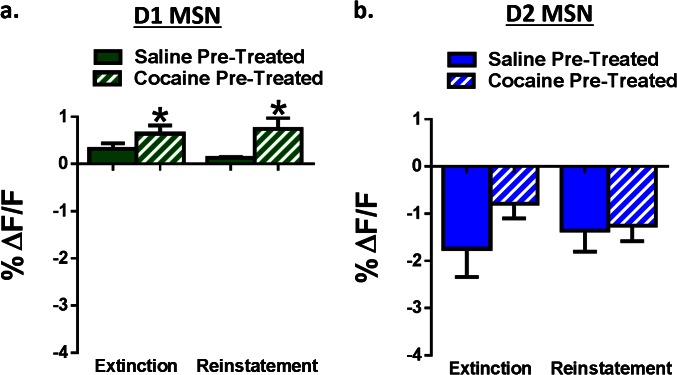
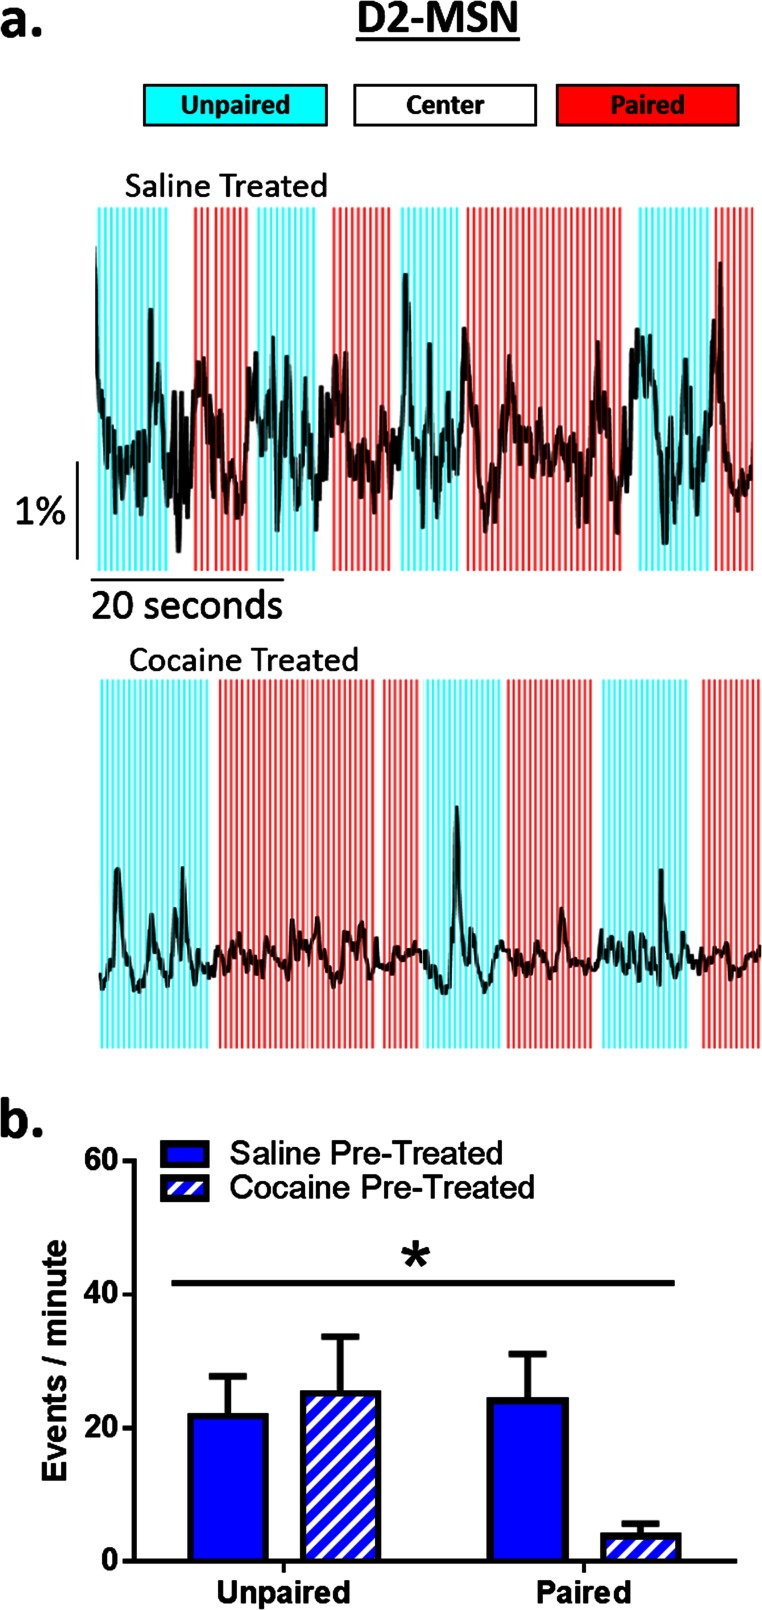
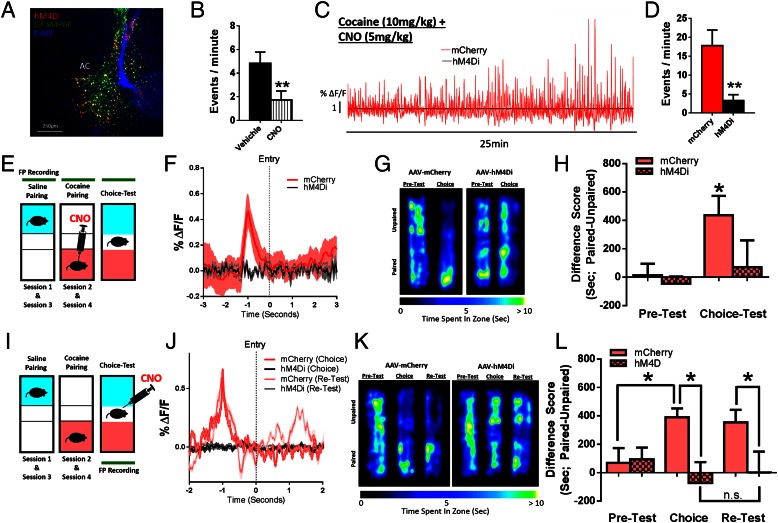
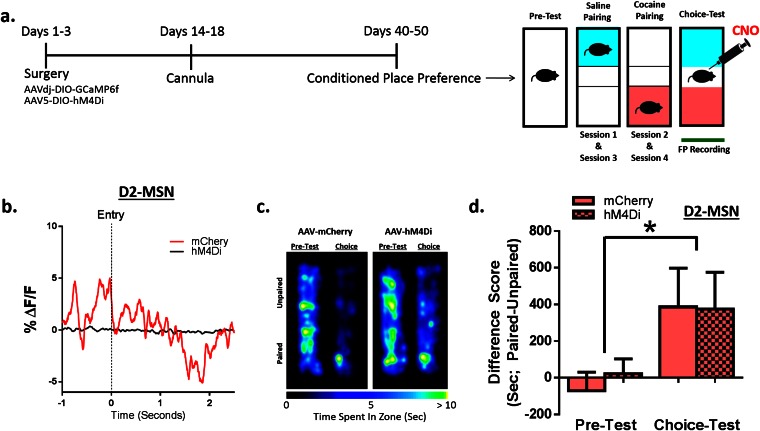
The reinforcing and rewarding properties of cocaine are attributed to its ability to increase dopaminergic transmission in nucleus accumbens (NAc). This action reinforces drug taking and seeking and leads to potent and long-lasting associations between the rewarding effects of the drug and the cues associated with its availability. The inability to extinguish these associations is a key factor contributing to relapse. Dopamine produces these effects by controlling the activity of two subpopulations of NAc medium spiny neurons (MSNs) that are defined by their predominant expression of either dopamine D1 or D2 receptors. Previous work has demonstrated that optogenetically stimulating D1 MSNs promotes reward, whereas stimulating D2 MSNs produces aversion. However, we still lack a clear understanding of how the endogenous activity of these cell types is affected by cocaine and encodes information that drives drug-associated behaviors. Using fiber photometry calcium imaging we define D1 MSNs as the specific population of cells in NAc that encodes information about drug associations and elucidate the temporal profile with which D1 activity is increased to drive drug seeking in response to contextual cues. Chronic cocaine exposure dysregulates these D1 signals to both prevent extinction and facilitate reinstatement of drug seeking to drive relapse. Directly manipulating these D1 signals using designer receptors exclusively activated by designer drugs prevents contextual associations. Together, these data elucidate the responses of D1- and D2-type MSNs in NAc to acute cocaine and during the formation of context-reward associations and define how prior cocaine exposure selectively dysregulates D1 signaling to drive relapse.

Keywords: associative learning; calcium imaging; cocaine; medium spiny neuron; reward.


Conflict of interest statement

The authors declare no conflict of interest.

Figures

Fig. 1.
Fig. 1.
Biphasic responses of NAc neurons to cocaine-associated cues. (A) Timeline of the experimental design. (B) Viral expression of AAV-GCaMP6f and placement of the fiber-optic probe in NAc core. (C) Representative Ca2+ traces from a single animal over pairing sessions. Data are represented as the percent change in fluorescence over the mean fluorescence (ΔF/F). (D) Peak analysis of Ca2+ imaging traces. Cocaine reduces the number of events [Student’s t test; t(5) = 3.48, P < 0.05, n = 6]. (E) (Left) Animals formed a preference for the chamber associated with cocaine [Student’s t test; t(5) = 4.04, P < 0.01, n = 6]. (Right) Heat maps showing time spent in each area of the chamber. (F) Representative traces demonstrating the temporal profile of NAc activity around paired and unpaired chamber entry. (G) Quantification of the peak amplitude of the Ca2+ signal in the five seconds preceding paired and unpaired chamber entry [Student’s t test; t(5) = 4.38, P < 0.01, n = 6]. (H) Representative trace showing the change in event frequency when the animal is in the paired or unpaired chamber. (I) Quantification of event frequency [Student’s t test; t(5) = 2.68, P < 0.05, n = 6]. *P < 0.05, **P < 0.01.
Fig. 2.
Fig. 2.
Specific contribution of D1 and D2 NAc MSNs to learning cocaine-associated cues. (A) Representative Ca2+ traces and peak analysis from a D1-Cre (Left, green) and D2-Cre (Right, blue) mouse showing higher activity of D2-MSNs under baseline conditions. Cocaine increases D1 events [Student’s t test; t(3) = 5.84, P < 0.05, n = 4] and decreases D2 events [Student’s t test; t(4) = 2.92, P < 0.05, n = 4] in NAc. (B) (Left) Animals formed a conditioned preference [Student’s t test; t(21) = 3.96, P < 0.001, n = 22]. (Right) Heat maps showing time spent in each area of the CPP chamber. (C) (Top) Representative heat map of D1-MSN-mediated Ca2+ signaling during successive entries into the drug-paired chamber. (Bottom) Averaged D1 traces (also see Movie S1). Quantification of peak amplitude of Ca2+ events 5 s around entry [Student’s t test; t(10) = 2.61, P < 0.05, n = 11]. (D) (Top) Heat map of D2-MSN-mediated Ca2+ signaling during successive entries into the drug-paired chamber. (Bottom) Averaged D2 traces (also see Movie S2). Quantification of peak amplitude of Ca2+ events [Student’s t test; t(9) = 2.70, P < 0.05, n = 10]. (E) Correlation analysis showing the relationship between CPP and the amplitude of D1 events preceding drug-paired chamber entry (r = 0.63, P < 0.05, n = 11). (F) Correlation analysis showing no relationship with D2 events (r = −0.15, P = not significant, n = 10). *P < 0.05, **P < 0.01, ***P < 0.001.
Fig. S1.
Fig. S1.
Viral targeting and infection rate of the calcium indicator GCaMP6f across mouse strains. (A) Representative image denoting recording sites in D1-Cre (Left) and D2-Cre (Right) mouse lines. (B) D2 MSNs displayed a greater number of events per minute compared with D1 MSNs under baseline conditions. (C) Cell counting was carried out to determine the number of cells within each mouse line that expressed the calcium indicator. There were no differences between D1- or D2-Cre mice. (D) There were also no differences in the number of cells expressing the calcium indicator between saline- and cocaine-pretreated animals. *P < 0.05 vs. control. All data are presented as mean ± SEM.
Fig. 3.
Fig. 3.
Chronic cocaine administration alters D1 MSN signaling in association with reduced extinction and facilitated reinstatement of CPP. (A) Experimental timeline. (B) Animals form a preference for the drug-paired chamber [two-way ANOVA; F (1, 88) = 14.17, P < 0.001, n = 14]; cocaine pretreatment does not change CPP. (C) Heat maps showing time spent in each chamber. (D) Chronic cocaine administration impairs extinction and facilitates cocaine-primed reinstatement [two-way ANOVA; F (1, 147) = 20.08, P < 0.0001; n = 20]. Data plotted as percent change from the original choice test. During extinction test 1, cocaine pretreated animals increased their preference (one-sample t test; t22 = 2.56, P < 0.05). During reinstatement, cocaine-pretreated animals reinstated above their original choice test values (one-sample t test; t22 = 2.09, P < 0.05). (E) Representative traces averaged over entries showing increased amplitude of D1 MSN Ca2+ activity at paired chamber entry during extinction. (F) Peak amplitude analysis. Saline-treated animals extinguish D1 MSN responses; cocaine pretreated animals do not [two-way ANOVA; F (1, 17) = 4.492, P < 0.05, n = 10]. (G) Representative traces averaged over entries showing increased amplitude of D1 MSN Ca2+ activity at paired chamber entry during cocaine-primed reinstatement. (H) Peak amplitude analysis over trials. Cocaine-treated animals reinstate D1 MSN responses, whereas saline-pretreated animals do not [two-way ANOVA; F (1, 12) = 5.262, P < 0.05, n = 6, 9]. (I) Representative D1 MSN traces from a cocaine-treated (Left) and saline-treated (Right) animal during reinstatement. Acute effects of the cocaine challenge are augmented in cocaine pretreated animals, but only when the animal is in the paired chamber. (J) Peak analysis: cocaine effects are enhanced in cocaine-pretreated animals in the previously drug-paired context [two-way ANOVA; F (1, 4) = 22.16, P < 0.01, n = 3]. *P < 0.05, **P < 0.01, ***P < 0.001, #### P < 0.0001.
Fig. S2.
Fig. S2.
Cocaine preexposure increases cocaine-induced locomotor activity. (A) Open-field analysis plotting distance traveled in centimeters over a 10-min session. Animals were placed into the chamber 15 min following an i.p. injection of 10 mg/kg cocaine. Cocaine-pretreated animals exhibited increased cocaine-induced locomotor activity compared with saline treated controls [Student’s t test; t(38) = t = 2.50, P < 0.05, n = 22, 19]. Interestingly, this sensitized locomotor response did not correlate with reduced extinction on an individual animal basis, suggesting the involvement of at least partly different underlying mechanisms. (B) Open-field analysis showing time spent in each area of the open-field chamber. There were no differences between groups. *P < 0.05 vs. control. All data are presented as mean ± SEM.
Fig. S3.
Fig. S3.
Cocaine pretreatment alters baseline D1, but not D2, MSN activity. (A) Representative calcium traces from D1 (Top, green) and D2 (Bottom, blue) MSNs at baseline and following 7 d of cocaine injections and withdrawal. (B) Peak analysis of D1 MSNs (Left) showing that cocaine and withdrawal increases the number of events in the NAc relative to baseline [Student’s t test; t(5) = 4.23, P < 0.01, n = 6]. In contrast, D2 MSN activity (Right) was unchanged [Student’s t test; t(6) = 1.24, P = not significant, n = 7]. **P < 0.01 vs. control. All data are presented as mean ± SEM.
Fig. S4.
Fig. S4.
Cocaine pretreatment alters temporally specific D1, but not D2, MSN activity. (A) Group data showing that peak D1 amplitude is increased in cocaine pretreated animals during both extinction and reinstatement compared with saline-pretreated controls [two-way ANOVA; F (1, 26) = 6.44, P < 0.05, n = 6, 9]. (B) Group data showing that D2 signaling is unchanged between cocaine and saline pretreated animals during both extinction and reinstatement. *P < 0.05. All data are presented as mean ± SEM.
Fig. S5.
Fig. S5.
The acute effects of cocaine are enhanced by drug-associated contextual cues in cocaine-, but not saline-, pretreated animals. (A) Representative traces showing D2 signaling across 60 s of a conditioned place preference session in saline-treated (Top) and cocaine-treated (Bottom) animals following a challenge dose of 5 mg/kg cocaine. (B) Frequency analysis during time in the paired and unpaired chamber in D2 MSNs during a cocaine-primed reinstatement session. Cocaine reduced D2 firing, only when the animal was present in the previously drug-paired context [two-way ANOVA; interaction; F (1, 4) = 10.12, P < 0.05, n = 3]. *P < 0.05 ANOVA. All data are presented as mean ± SEM.
Fig. 4.
Fig. 4.
D1 MSN activity is required for the expression of cocaine CPP. (A) Confocal image showing hM4Di and GCaMP6f coexpression in NAc. (B) CNO reduces D1-mediated Ca2+ activity. (C) Representative D1 Ca2+ traces from mCherry (red) and hM4D1 (black) animals following cocaine (10 mg/kg i.p.). (D) Peak analysis of D1 MSNs. CNO reduces the frequency of events [Student’s t test; t(5) = 4.87, P < 0.01, n = 6]. (E) Animals were injected with CNO (5 mg/kg i.p.) before pairing sessions. (F) Representative traces averaged over entries. (G) Time spent in each area of the CPP chamber. (H) Animals form a preference for the drug-paired chamber, with CNO reducing the time spent in the drug-paired chamber [two-way ANOVA; F (1, 28) = 4.55, P < 0.05, n = 8]. (I) Animals were injected with CNO before choice test . (J) Representative traces averaged over entries showing increased amplitude of D1 MSN Ca2+ activity at paired chamber entry. (K) Time spent in each area of the CPP chamber. (L) Animals form a preference for the drug-paired chamber, with CNO reducing the time spent in the drug-paired chamber. The reduced preference in hM4Di animals remained 2 wk after the initial choice test [two-way ANOVA; F (1, 37) = 5.32, P < 0.05, n = 5, 10]. *P < 0.05, **P < 0.01.
Fig. S6.
Fig. S6.
Blocking D2 MSN activity during posttesting does not alter place preference for cocaine. (A) Animals were injected with AAV-DIO-hM4D to inhibit the activity of D2 MSNs. Animals were injected with CNO (5 mg/kg) before posttest sessions to determine the causal relationship between MSN activity and the expression of previously learned associations. (B) Representative traces showing that D2 MSN activity at paired chamber entry was blocked for hM4D (black) but not mCherry (red) animals. (C) Heat maps showing time spent in each area of the CPP chamber for D2-Cre animals that expressed AAV-DIO-mCherry (Left) or AAV-DIO-hM4D (Right). (D) Group data showing that animals form a preference for the drug-paired chamber [two-way ANOVA; F (1, 7) = 6.27, P < 0.05, n = 5] that is not blocked by CNO administered 1 h before preference testing. *P < 0.05. All data are presented as mean ± SEM.

Comment in

References

    1. Phillips PE, Stuber GD, Heien ML, Wightman RM, Carelli RM. Subsecond dopamine release promotes cocaine seeking. Nature. 2003;422(6932):614–618. - PubMed
    1. Schultz W. Behavioral theories and the neurophysiology of reward. Annu Rev Psychol. 2006;57:87–115. - PubMed
    1. Steinberg EE, et al. A causal link between prediction errors, dopamine neurons and learning. Nat Neurosci. 2013;16(7):966–973. - PMC - PubMed
    1. Schultz W, Dayan P, Montague PR. A neural substrate of prediction and reward. Science. 1997;275(5306):1593–1599. - PubMed
    1. du Hoffmann J, Nicola SM. Dopamine invigorates reward seeking by promoting cue-evoked excitation in the nucleus accumbens. J Neurosci. 2014;34(43):14349–14364. - PMC - PubMed

Publication types

MeSH terms