. 2016 Feb 23;113(8):2134-9.
doi: 10.1073/pnas.1524861113. Epub 2016 Feb 1.

An ecocultural model predicts Neanderthal extinction through competition with modern humans

Affiliations

An ecocultural model predicts Neanderthal extinction through competition with modern humans

William Gilpin et al. Proc Natl Acad Sci U S A. .

Abstract

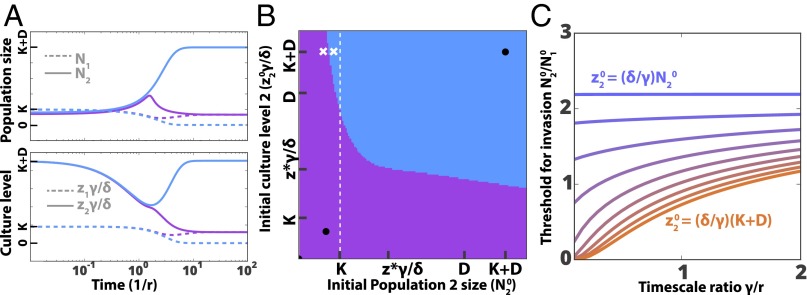
Archaeologists argue that the replacement of Neanderthals by modern humans was driven by interspecific competition due to a difference in culture level. To assess the cogency of this argument, we construct and analyze an interspecific cultural competition model based on the Lotka-Volterra model, which is widely used in ecology, but which incorporates the culture level of a species as a variable interacting with population size. We investigate the conditions under which a difference in culture level between cognitively equivalent species, or alternatively a difference in underlying learning ability, may produce competitive exclusion of a comparatively (although not absolutely) large local Neanderthal population by an initially smaller modern human population. We find, in particular, that this competitive exclusion is more likely to occur when population growth occurs on a shorter timescale than cultural change, or when the competition coefficients of the Lotka-Volterra model depend on the difference in the culture levels of the interacting species.

Keywords: Lotka−Volterra; Paleolithic; cultural evolution; feedback; replacement.


Conflict of interest statement

The authors declare no conflict of interest.

Figures

Fig. 1.
Fig. 1.
Modern human invasion of a Neanderthal population. (A) Trajectories for invasion with the modern humans (solid traces) starting at a lower initial population size than the Neanderthals (dashed traces), but with an initially higher culture level. (Top) Population sizes versus time and (Bottom) the culture levels. Purple traces correspond to N20/N10=0.7, which is too low for replacement, whereas blue traces indicate replacement when N20/N10=0.9. (B) Basins of attraction to coexistence (purple; final population sizes are equal and nonzero) and replacement (blue; final size of population 1 is zero). The initial conditions for population 2 in A are marked by white crosses in B, and the equilibria are marked by black disks. (C) The effect of varying the timescale ratio, γ/r, on the threshold initial population ratio, N20/N10, necessary for replacement. The different lines correspond to different initial culture levels for the invading population. In this figure, K1=K2=K=10, D1=D2=D=40, b12=b21=b=0.5, z1*=z2*=z*=10, and r1=r2=r=1. For A and B, γ1=γ2=γ=1 and δ1=δ2=δ=1/2.2. Initial values are N10=K=10 and z10=(δ/γ)K=10/2.2.
Fig. 2.
Fig. 2.
Effect of increasing competition on invasion. (A) The basins of attraction in the (N20,z20) plane for three values of the competition coefficient b. For low enough competition (Left), asymmetric coexistence (green) and symmetric coexistence (purple) occur and are locally stable. As competition increases (Middle), the asymmetric coexistence solutions become exclusion solutions (blue). With even larger b (Right), low symmetric coexistence becomes a pair of low exclusion equilibria (light yellow and light blue), both locally stable. Invasion cannot occur in the light yellow region. (B) A bifurcation diagram showing how equilibrium sizes of the two populations vary with b (stable equilibria, solid lines; unstable equilibria, dashed lines). All other parameter and initial values are as in Fig. 1.
Fig. 3.
Fig. 3.
Effect of competition feedback on coexistence. (A) The ε dependence of the ratio N20/N10 necessary for population 2 with culture level z20=(δ/γ)(K+D) to exclude population 1 at the low edge equilibrium 11. (B) An analytic phase diagram of the effect of the feedback ε and competition amplitude b0 on existence and local stability of each equilibrium in the feedback model. (C) A legend showing the stable equilibria available in each of the six regions, listed from left to right with matching colors. All parameters except ε and b0 are as given in Fig. 1.

References

    1. Viola B, Pääbo S. What’s new in Central Asia? In: Shunkov MV, Molodin V, editors. Basic Issues in Archaeology, Anthropology and Ethnography of Eurasia: Festschrift on the Occasion of Anatoly Derevianko’s 70th Birthday. SB RAS Press; Novosibirsk, Russia: 2013. pp. 555–565.
    1. Prüfer K, et al. The complete genome sequence of a Neanderthal from the Altai Mountains. Nature. 2014;505(7481):43–49. - PMC - PubMed
    1. Finlayson C. On the importance of coastal areas in the survival of Neanderthal populations during the Late Pleistocene. Quat Sci Rev. 2008;27(23):2246–2252.
    1. Underdown S. A potential role for transmissible spongiform encephalopathies in Neanderthal extinction. Med Hypotheses. 2008;71(1):4–7. - PubMed
    1. Banks WE, et al. Neanderthal extinction by competitive exclusion. PLoS One. 2008;3(12):e3972. - PMC - PubMed

Publication types

LinkOut - more resources