Clinical Value of Tumor Markers for Determining Cause of Pleural Effusion
- PMID: 26831224
- PMCID: PMC4799566
- DOI: 10.4103/0366-6999.174501
Clinical Value of Tumor Markers for Determining Cause of Pleural Effusion
Abstract
Background: It is often challenging to distinguish tuberculous pleural effusion (TPE) from malignant pleural effusion (MPE); thoracoscopy is among the techniques with the highest diagnostic ability in this regard. However, such invasive examinations cannot be performed on the elderly, or on those in poor physical condition. The aim of this study was to explore the differential diagnostic value of carbohydrate antigen 125 (CA125), carbohydrate antigen 199 (CA199), carcinoembryonic antigen (CEA), neuron-specific enolase (NSE), and squamous cell carcinoma (SCC) associated antigen in patients with TPE and MPE.
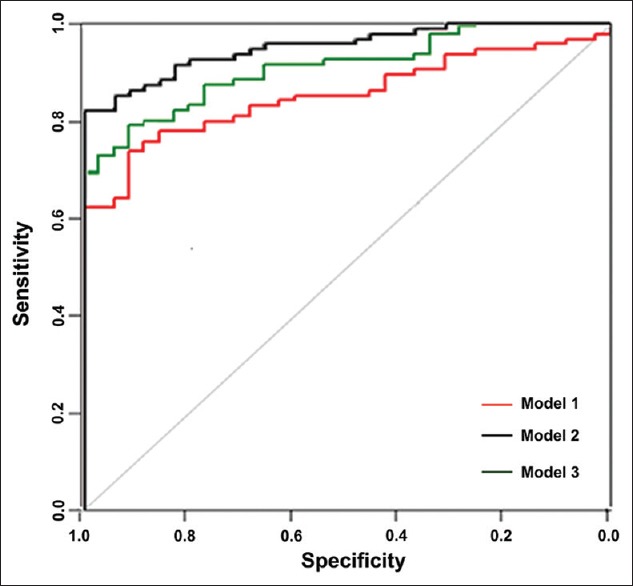
Methods: Using electrochemiluminescence, we measured the concentration of tumor markers (TMs) in the pleural effusion and serum of patients with TPE (n = 35) and MPE (n = 95). We used receiver operating characteristic (ROC) curve analysis to evaluate the TMs and differentiate between TPE and MPE.
Results: The cut-off values for each TM in serum were: CA125, 151.55 U/ml; CA199, 9.88 U/ml; CEA, 3.50 ng/ml; NSE, 13.27 ng/ml; and SCC, 0.85 ng/ml. Those in pleural fluid were: CA125, 644.30 U/ml; CA199, 12.08 U/ml; CEA, 3.35 ng/ml; NSE, 9.71 ng/ml; and SCC, 1.35 ng/ml. The cut-off values for the ratio of pleural fluid concentration to serum concentration (P/S ratio) of each TM were: CA125, 5.93; CA199, 0.80; CEA, 1.47; NSE, 0.76; and SCC, 0.90. The P/S ratio showed the highest specificity in the case of CEA (97.14%). ROC curve analysis revealed that, for all TMs, the area under the curve in pleural fluid (0.95) was significantly different from that in serum (0.85; P < 0.001).
Conclusions: TMs in TPE differ significantly from those in MPE, especially when detected in pleural fluid. The combined detection of TMs can improve diagnostic sensitivity.
Figures
References
-
- Alemán C, Sanchez L, Alegre J, Ruiz E, Vázquez A, Soriano T, et al. Differentiating between malignant and idiopathic pleural effusions: The value of diagnostic procedures. QJM. 2007;100:351–9. doi: 10.1093/qjmed/hcm032. - PubMed
-
- Hackbarth JS, Murata K, Reilly WM, Algeciras-Schimnich A. Performance of CEA and CA19-9 in identifying pleural effusions caused by specific malignancies. Clin Biochem. 2010;43:1051–5. doi: 10.1016/j.clinbiochem.2010.05.016. - PubMed
-
- Wang XF, Wu YH, Wang MS, Wang YS. CEA, AFP, CA125, CA153 and CA199 in malignant pleural effusions predict the cause. Asian Pac J Cancer Prev. 2014;15:363–8. doi: 10.7314/APJCP.2014.15.1.363. - PubMed
Publication types
MeSH terms
Substances
LinkOut - more resources
Full Text Sources
Other Literature Sources
Research Materials
Miscellaneous