. 2016 Mar;15(3):960-74.
doi: 10.1074/mcp.M115.053165. Epub 2016 Feb 1.

Proteomic and Genomic Analyses of the Rvb1 and Rvb2 Interaction Network upon Deletion of R2TP Complex Components

Affiliations

Proteomic and Genomic Analyses of the Rvb1 and Rvb2 Interaction Network upon Deletion of R2TP Complex Components

Mahadevan Lakshminarasimhan et al. Mol Cell Proteomics. 2016 Mar.

Abstract

The highly conserved yeast R2TP complex, consisting of Rvb1, Rvb2, Pih1, and Tah1, participates in diverse cellular processes ranging from assembly of protein complexes to apoptosis. Rvb1 and Rvb2 are closely related proteins belonging to the AAA+ superfamily and are essential for cell survival. Although Rvbs have been shown to be associated with various protein complexes including the Ino80 and Swr1chromatin remodeling complexes, we performed a systematic quantitative proteomic analysis of their associated proteins and identified two additional complexes that associate with Rvb1 and Rvb2: the chaperonin-containing T-complex and the 19S regulatory particle of the proteasome complex. We also analyzed Rvb1 and Rvb2 purified from yeast strains devoid of PIH1 and TAH1. These analyses revealed that both Rvb1 and Rvb2 still associated with Hsp90 and were highly enriched with RNA polymerase II complex components. Our analyses also revealed that both Rvb1 and Rvb2 were recruited to the Ino80 and Swr1 chromatin remodeling complexes even in the absence of Pih1 and Tah1 proteins. Using further biochemical analysis, we showed that Rvb1 and Rvb2 directly interacted with Hsp90 as well as with the RNA polymerase II complex. RNA-Seq analysis of the deletion strains compared with the wild-type strains revealed an up-regulation of ribosome biogenesis and ribonucleoprotein complex biogenesis genes, down-regulation of response to abiotic stimulus genes, and down-regulation of response to temperature stimulus genes. A Gene Ontology analysis of the 80 proteins whose protein associations were altered in the PIH1 or TAH1 deletion strains found ribonucleoprotein complex proteins to be the most enriched category. This suggests an important function of the R2TP complex in ribonucleoprotein complex biogenesis at both the proteomic and genomic levels. Finally, these results demonstrate that deletion network analyses can provide novel insights into cellular systems.


Figures

Fig. 1.
Fig. 1.
Rvb1 and Rvb2 both associate with the other R2TP subunits Pih1 and Tah1, and copurify with a functionally diverse group of other protein complexes. A, components of the R2TP complex copurify with Rvb1 and Rvb2. Either Rvb1-TAP or Rvb2-TAP associated proteins were isolated from whole cell extracts of the strains indicated by TAP purification, and identified using MudPIT mass spectrometry. Relative amounts of each protein are estimated using dBNSAF values, where the dNSAF value for each protein was divided by the dNSAF value of the bait protein. The average relative amounts of the four R2TP subunits Rvb1, Rvb2, Pih1, and Tah1 are indicated (average dBNSAF values calculated from 3 biological replicates). Error bars indicate standard deviation. B, Rvb1/Rvb2 associated proteins. Proteins enriched in the Rvb1 and Rvb2 purified wild-type samples described in A, but not in control purifications were identified by PLGEM analysis as previously described (22) (FDR <0.05, except for: the snoRNP subunit Nop56; the CCT complex components Cct2, Cct6, Hsp42, Ssa1 and Ssa2). The area proportional Venn diagram was generated using “Venn Diagram Plotter” (PNNL, http://omics.pnl.gov/). C, protein complexes captured by Rvb1/2. For each complex the number of complex components captured (left) and the total number of known subunits for each complex (right) is indicated. D and E, dBNSAF values of CCT and proteasome complex components that are present in both Rvb1 and Rvb2 purifications.
Fig. 2.
Fig. 2.
Quantitative Proteomic Analysis of Top Rvb1/2 Interacting Proteins. A, Thirty six of the top proteins interacting with Rvb1 sorted from highest to lowest abundance after contaminant extraction. The focus of the graph is on proteins from the Ino80 complex (I), Swr1 complex (S), the Proteasome (P), the R2TP complex (R), and proteins in both Ino80 and Swr1 (B). The first 33 proteins are the 33 most abundant proteins found in the Rvb1-TAP purification after contaminant extraction. The average and standard deviation is shown for three biological replicates. B, Thirty six of the top proteins interacting with Rvb2 sorted from highest to lowest abundance after contaminant extraction. The focus of the graph is on proteins from the Ino80 complex (I), Swr1 complex (S), the Proteasome (P), the R2TP complex (R), and proteins in both Ino80 and Swr1 (B). The first 34 proteins are the 34 most abundant proteins found in the Rvb2-TAP purification after contaminant extraction. The average and standard deviation is shown for three biological replicates. C, The Copies per Cell information (36) was available for 35 of the 36 proteins listed in A and B (Tah1 missing from CpC data, while Act1, Hsc82 and Rpt5 were excluded for scale purpose). The inset graph is an expansion of the Ino80 (I) and Swr1 (S) specific components demonstrating the higher abundance of Ino80 proteins versus Swr1 proteins.
Fig. 3.
Fig. 3.
Rvb1 and Rvb2 interact directly with Hsp90. A, Hsp90 copurifies with Rvb1/2 complexes purified from S. cerevisiae. Average dBNSAF values for Hsp90 are from the 3 biological replicates; error bars are standard deviation. B, recombinant Hsp90 expressed in Sf21 cells interacts with recombinant Rvb1/2 in the absence of other yeast proteins. Sf21 cells coinfected with baculoviruses encoding His-TEV-Rvb1, FLAG-Rvb2 and Halo-TEV-Hsp90 were prepared as described in Experimental Procedures. Affinity purifications were performed as shown in the purification scheme and various fractions were analyzed by SDS-PAGE and proteins visualized by staining with Coomassie Blue R-250. In addition, Western blot (on fraction F) and mass spectrometry (fraction K) analyses were performed to test for the presence of Rvb1, Rvb2 and Hsp90. Please note because one gel had high background, we scanned the Coomassie stained gel as a black and white image using the Odyssey Infrared Imaging system (LI-COR, Lincoln, NE), which improves the resolution of the gel. C, interaction between purified recombinant Hsp90 mixed with either purified Rvb1 or Rvb2. Sf21 cells were infected with baculoviruses encoding affinity tagged Rvb1, Rvb2 or Hsp90 and these proteins were affinity purified individually. Samples containing ∼50 μg of each protein were mixed and incubated for 30 min at room temperature in the combinations indicated. Mixtures were subjected to either His (Ni-NTA) purification or FLAG purification, the indicated fractions analyzed by SDS-PAGE, and proteins visualized by staining with Coomassie Blue R-250. Elution fractions from all 3 purifications (fractions M, N and O) were subjected to mass spectrometry analysis to confirm the presence of proteins of interest. Abbreviations: FT = flow through; W = wash; E = elution. Color coded arrows represent proteins presented in the purification scheme.
Fig. 4.
Fig. 4.
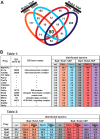
R2TP complexes lacking subunits Pih1 or Tah1 have an increased association with components of the RNA polymerase II and snoRNP complexes. A, a subset of proteins associate with Rvb1 and Rvb2 complexes purified without Pih1 or Tah1. Proteins present in the indicated purifications (described in Fig. 1), but not in control purifications, were identified using PLGEM analysis. The Venn diagram was generated using “Venny” (Oliveros, J.C. (2007–2015) Venny. An interactive tool for comparing lists with Venn's diagrams. http://bioinfogp.cnb.csic.es/tools/venny/). B, increased association of a set of proteins with Rvb1/2 in the absence of Pih1 or Tah1. Table I, representative proteins from the common 80 proteins shown in A, which are enriched in purifications using PIH1Δ or TAH1Δ deletion strains, compared with purifications using the wild-type strains. Average distributed spectral counts (dS) from three biological replicates are shown. Table II, RNAPII and snoRNP subunits are enriched in Rvb1/2 -TAP purifications using strains lacking the PIH1 or TAH1 genes (RNAPII subunits- Rpb1 and Rpb2: snoRNP subunits- Nop1 and Nop56).
Fig. 5.
Fig. 5.
Interaction between Rvb1/2 and RNApolymerase II complex. A, left panel, TAP-purified samples of the indicated strains were analyzed by Western blotting. Rvb1/2 proteins were visualized with rabbit anti-TAP polyclonal antibodies and IRDye®800CW anti-rabbit secondary antibodies (green). Rvb1 associated proteins purified from S. cerevisiae lacking Pih1 are enriched for the pol II subunit Rpb1. A, right panel, Whole cell extracts prepared from the indicated yeast strains were analyzed for the presence of RNAPII subunit Rpb1 by fractionating samples using SDS-PAGE and detecting proteins by Western blotting. Rpb1 was detected with mouse anti-Rpb1 monoclonal antibodies and IRDye® 680LT anti-mouse secondary antibodies (red); tubulin was detected with rabbit anti-tubulin monoclonal antibodies and IRDye®800CW anti-rabbit secondary antibodies (green). Li-Cor Odyssey software was used for both imaging and band quantitation. Band quantitation was repeated on Western blots for three biological replicates; average values are plotted. B, Rpb1 association with Rvb1 or Rvb2 depends on Pih1 and Tih1. Average dBNSAF values were calculated from the purifications used in Fig. 1. C, the absence of Pih1 or Tah1 does not significantly affect Rpb1 mRNA levels. RNA samples purified from whole cell extracts of the indicated strains were analyzed by either RNA-seq or qPCR as described in Experimental Procedures. D, interaction between RNA polymerase II purified from yeast and either recombinant Rvb1 or Rvb2 isolated from Sf21 insect cells. Representative Silver stained gel showing purified RNAPII complex that was used as input (for inputs of Rvb1 and Rvb2 refer to Fig. 2C left panel). Approximately 10 μg samples of Rvb1, Rvb2 or RNAPII complex were mixed in the combinations indicated, affinity purified, and analyzed by SDS-PAGE and Western blotting.
Fig. 6.
Fig. 6.
Association between R2TP (with or without Pih1 or Tah1), and the Swr1 and Ino80 complexes. A, B, association of Swr1 complex subunits with R2TP with or without Pih1 or Tah1. A, components of the Swr1 complex were identified in the samples described in Fig. 1A. 1B, the relative amounts of the mRNA transcripts corresponding to each Swr1 subunit were calculated by using RNA-seq to analyze samples of total RNA purified from whole cell extracts. FPKM = fragments per kilobase (of exon) per million (fragments mapped). C, D, association of Ino80 complex subunits with R2TP with or without Pih1 or Tah1.
Fig. 7.
Fig. 7.
Comparison of Gene Expression Changes between Strains. A, RVB1-TAP and RVB2-TAP strains were compared with RVB1-TAP and RVB2-TAP strains with PIH1 and TAH1 deleted. Differentially expressed genes were identified using the DESeq2 package in R (25). Genes were considered differentially expressed if they had a p value<0.01 and a log2 fold change>0.7. An additional filtering removed lowly expressed genes with an average FPKM<10. The top genes were clustered with the default hierarchical clustering method in R (Raivo Kolde (2015). pheatmap: Pretty Heatmaps. R package version 1.0.2. http://CRAN.R-project.org/package = pheatmap) with a Euclidean distance measure. The heatmap created with the package pheatmap displays the data with standard row scaling to highlight the differences of individual genes across samples. B, The overlap of the top genes from each comparison are shown in the Venn diagram created with the Vennerable package in R (Jonathan Swinton (2013)). Vennerable: Venn and Euler area-proportional diagrams. R package version 3.0/r82. http://R-Forge.R-project.org/projects/vennerable/).

References

    1. Zhao R., Davey M., Hsu Y. C., Kaplanek P., Tong A., Parsons A. B., Krogan N., Cagney G., Mai D., Greenblatt J., Boone C., Emili A., and Houry W. A. (2005) Navigating the chaperone network: an integrative map of physical and genetic interactions mediated by the hsp90 chaperone. Cell 120, 715–727 - PubMed
    1. Te J., Jia L., Rogers J., Miller A., and Hartson S. D. (2007) Novel subunits of the mammalian Hsp90 signal transduction chaperone. J. Proteome Res. 6, 1963–1973 - PubMed
    1. Boulon S., Marmier-Gourrier N., Pradet-Balade B., Wurth L., Verheggen C., Jady B. E., Rothe B., Pescia C., Robert M. C., Kiss T., Bardoni B., Krol A., Branlant C., Allmang C., Bertrand E., and Charpentier B. (2008) The Hsp90 chaperone controls the biogenesis of L7Ae RNPs through conserved machinery. J. Cell Biol. 180, 579–595 - PMC - PubMed
    1. Zhao R., Kakihara Y., Gribun A., Huen J., Yang G., Khanna M., Costanzo M., Brost R. L., Boone C., Hughes T. R., Yip C. M., and Houry W. A. (2008) Molecular chaperone Hsp90 stabilizes Pih1/Nop17 to maintain R2TP complex activity that regulates snoRNA accumulation. J. Cell Biol. 180, 563–578 - PMC - PubMed
    1. Boulon S., Pradet-Balade B., Verheggen C., Molle D., Boireau S., Georgieva M., Azzag K., Robert M. C., Ahmad Y., Neel H., Lamond A. I., and Bertrand E. (2010) HSP90 and its R2TP/Prefoldin-like cochaperone are involved in the cytoplasmic assembly of RNA polymerase II. Mol. Cell 39, 912–924 - PMC - PubMed

Publication types

MeSH terms