

Temporal variability in trace metal solubility in a paddy soil not reflected in uptake by rice (Oryza sativa L.)
- PMID: 26832131
- PMCID: PMC5095167
- DOI: 10.1007/s10653-016-9803-7
Temporal variability in trace metal solubility in a paddy soil not reflected in uptake by rice (Oryza sativa L.)
Abstract
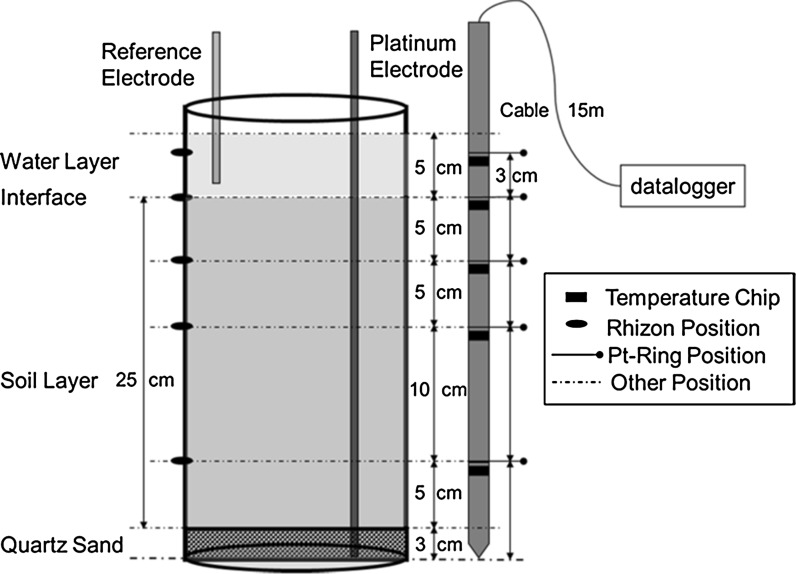
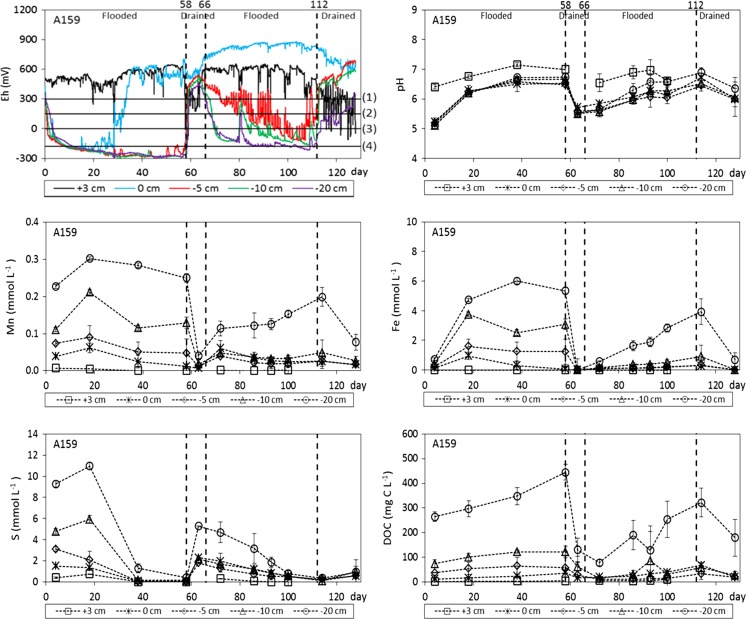
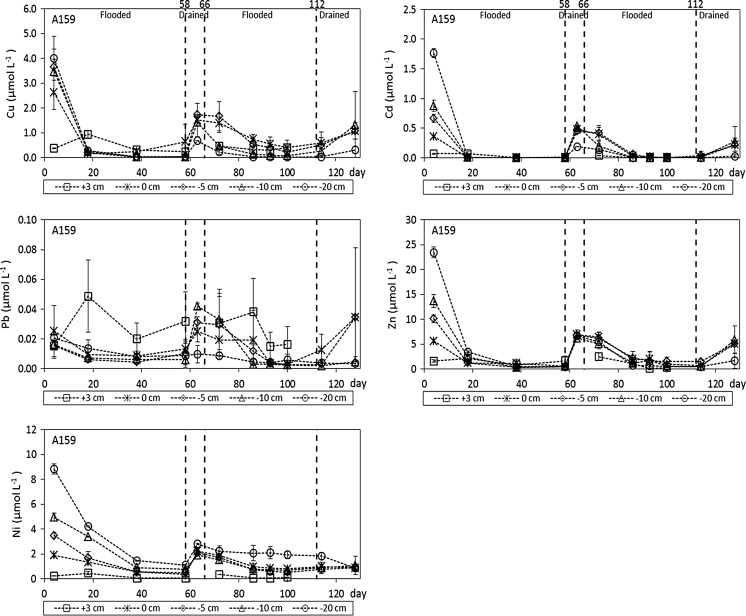
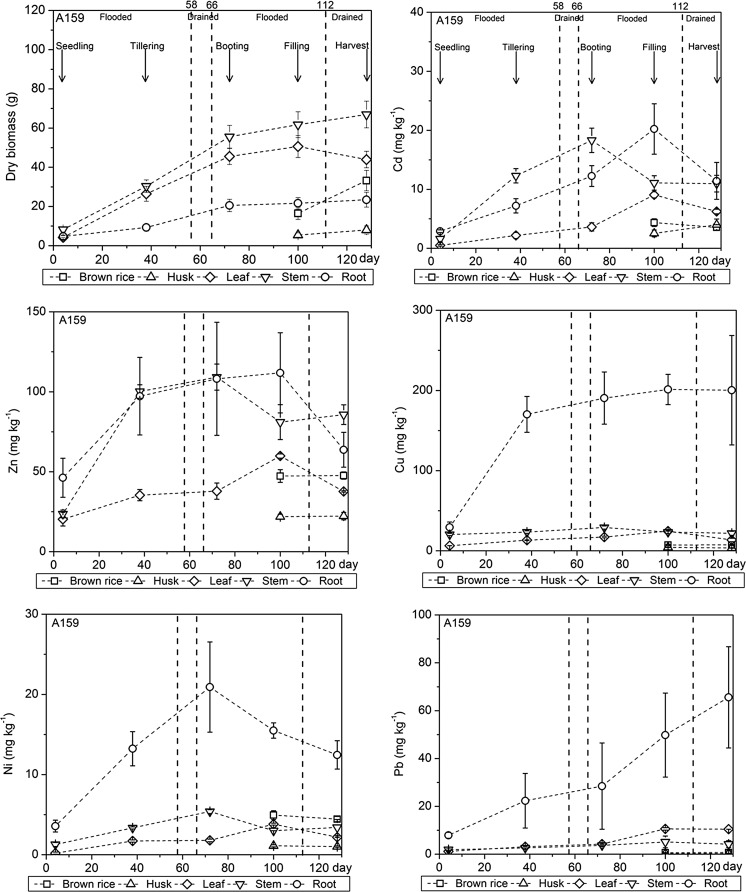
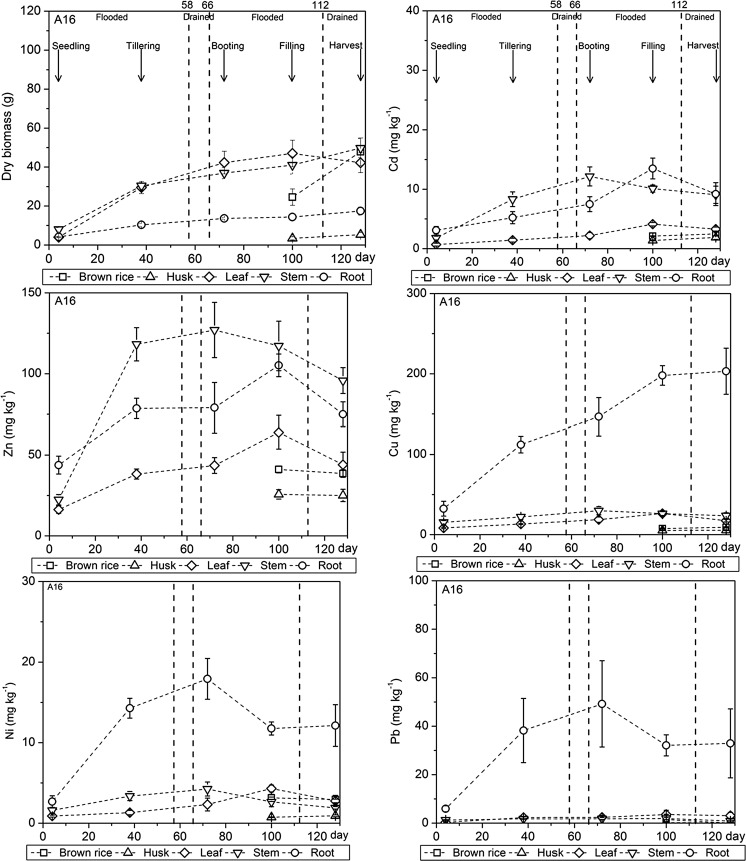
Alternating flooding and drainage conditions have a strong influence on redox chemistry and the solubility of trace metals in paddy soils. However, current knowledge of how the effects of water management on trace metal solubility are linked to trace metal uptake by rice plants over time is still limited. Here, a field-contaminated paddy soil was subjected to two flooding and drainage cycles in a pot experiment with two rice plant cultivars, exhibiting either high or low Cd accumulation characteristics. Flooding led to a strong vertical gradient in the redox potential (Eh). The pH and Mn, Fe, and dissolved organic carbon concentrations increased with decreasing Eh and vice versa. During flooding, trace metal solubility decreased markedly, probably due to sulfide mineral precipitation. Despite its low solubility, the Cd content in rice grains exceeded the food quality standards for both cultivars. Trace metal contents in different rice plant tissues (roots, stem, and leaves) increased at a constant rate during the first flooding and drainage cycle but decreased after reaching a maximum during the second cycle. As such, the high temporal variability in trace metal solubility was not reflected in trace metal uptake by rice plants over time. This might be due to the presence of aerobic conditions and a consequent higher trace metal solubility near the root surface, even during flooding. Trace metal solubility in the rhizosphere should be considered when linking water management to trace metal uptake by rice over time.
Keywords: Bioavailability; Paddy soils; Redox potential; Trace metal contamination; Uptake; Water management.
Figures


Similar articles
-
Assessment of Cd availability in rice cultivation (Oryza sativa): Effects of amendments and the spatiotemporal chemical changes in the rhizosphere and bulk soil.Ecotoxicol Environ Saf. 2020 Jun 15;196:110490. doi: 10.1016/j.ecoenv.2020.110490. Epub 2020 Apr 7. Ecotoxicol Environ Saf. 2020. PMID: 32276161
-
[Effects of Water Management on Cadmium Accumulation by Rice (Oryza sativa L.) Growing in Typical Paddy Soil].Huan Jing Ke Xue. 2021 May 8;42(5):2512-2521. doi: 10.13227/j.hjkx.202008305. Huan Jing Ke Xue. 2021. PMID: 33884822 Chinese.
-
Do soil Fe transformation and secretion of low-molecular-weight organic acids affect the availability of Cd to rice?Environ Sci Pollut Res Int. 2015 Dec;22(24):19497-506. doi: 10.1007/s11356-015-5134-y. Epub 2015 Aug 12. Environ Sci Pollut Res Int. 2015. PMID: 26260840
-
[Reducing cadmium content of rice grains by means of flooding and a few problems].Nihon Eiseigaku Zasshi. 2012;67(4):478-83. doi: 10.1265/jjh.67.478. Nihon Eiseigaku Zasshi. 2012. PMID: 23095358 Review. Japanese.
-
Challenges and opportunities to regulate mineral transport in rice.Biosci Biotechnol Biochem. 2021 Dec 22;86(1):12-22. doi: 10.1093/bbb/zbab180. Biosci Biotechnol Biochem. 2021. PMID: 34661659 Review.
Cited by
-
Soil properties and cultivars determine heavy metal accumulation in rice grain and cultivars respond differently to Cd stress.Environ Sci Pollut Res Int. 2019 May;26(14):14638-14648. doi: 10.1007/s11356-019-04727-9. Epub 2019 Mar 15. Environ Sci Pollut Res Int. 2019. PMID: 30877541
-
Reducing cadmium bioaccumulation in Theobroma cacao using biochar: basis for scaling-up to field.Heliyon. 2022 Jun 23;8(6):e09790. doi: 10.1016/j.heliyon.2022.e09790. eCollection 2022 Jun. Heliyon. 2022. PMID: 35785240 Free PMC article.
-
Toxic Metals in a Paddy Field System: A Review.Toxics. 2022 May 16;10(5):249. doi: 10.3390/toxics10050249. Toxics. 2022. PMID: 35622662 Free PMC article. Review.
-
Impacts of Nanobubbles in Pore Water on Heavy Metal Pollutant Release from Contaminated Soil Columns.Nanomaterials (Basel). 2023 May 18;13(10):1671. doi: 10.3390/nano13101671. Nanomaterials (Basel). 2023. PMID: 37242089 Free PMC article.
-
Overexpression of a High-Affinity Nitrate Transporter OsNRT2.1 Increases Yield and Manganese Accumulation in Rice Under Alternating Wet and Dry Condition.Front Plant Sci. 2018 Aug 15;9:1192. doi: 10.3389/fpls.2018.01192. eCollection 2018. Front Plant Sci. 2018. PMID: 30158947 Free PMC article.
References
-
- Allison, J. D., Brown, D. S., & Novo-Gradac, K. J. (1991). MINTEQA2/PRODEFA2, A geochemical assessment model for environmental systems: Version 3.0 user’s manual. US EPA, Athens, GA. EPA/600/3–91/021.
MeSH terms
Substances
LinkOut - more resources
Full Text Sources
Other Literature Sources
Research Materials
