

The extracellular matrix protein laminin-10 promotes blood-brain barrier repair after hypoxia and inflammation in vitro
- PMID: 26832174
- PMCID: PMC4736307
- DOI: 10.1186/s12974-016-0495-9
The extracellular matrix protein laminin-10 promotes blood-brain barrier repair after hypoxia and inflammation in vitro
Abstract
Background: The blood-brain barrier (BBB) of the central nervous system (CNS) is essential for normal brain function. However, the loss of BBB integrity that occurs after ischaemic injury is associated with extracellular matrix (ECM) remodelling and inflammation, and contributes to poor outcome. ECM remodelling also contributes to BBB repair after injury, but the precise mechanisms and contribution of specific ECM molecules involved are unknown. Here, we investigated the mechanisms by which hypoxia and inflammation trigger loss of BBB integrity and tested the hypothesis ECM changes could contribute to BBB repair in vitro.
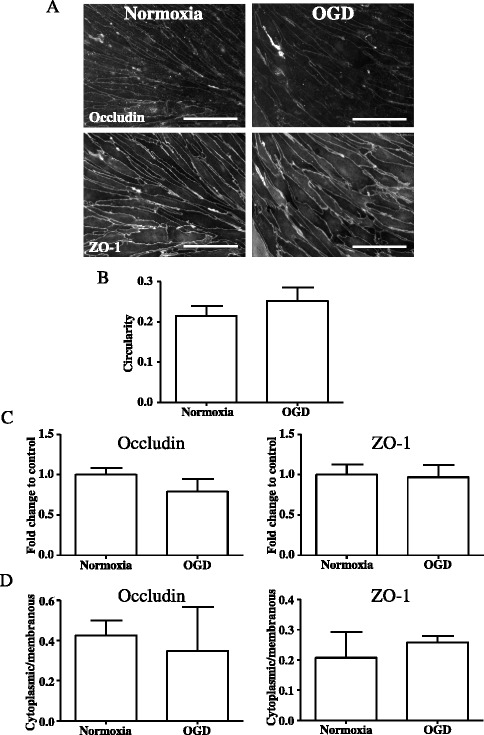
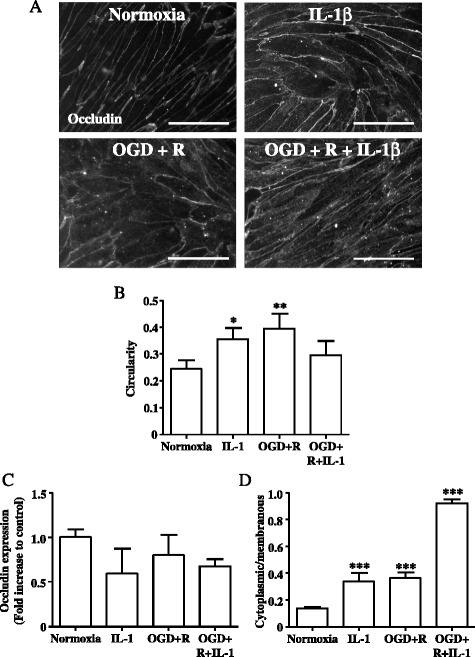
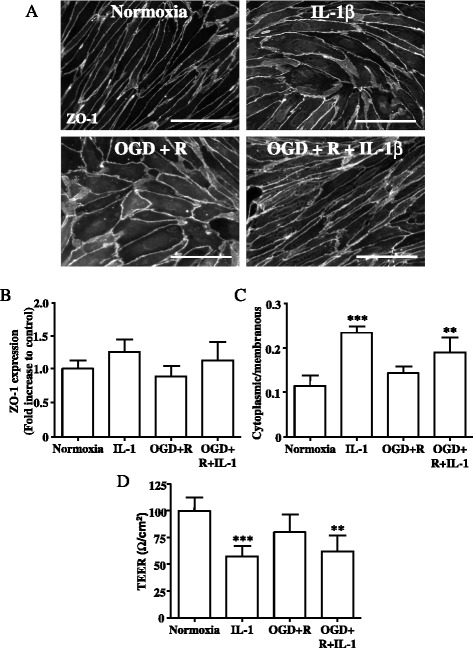
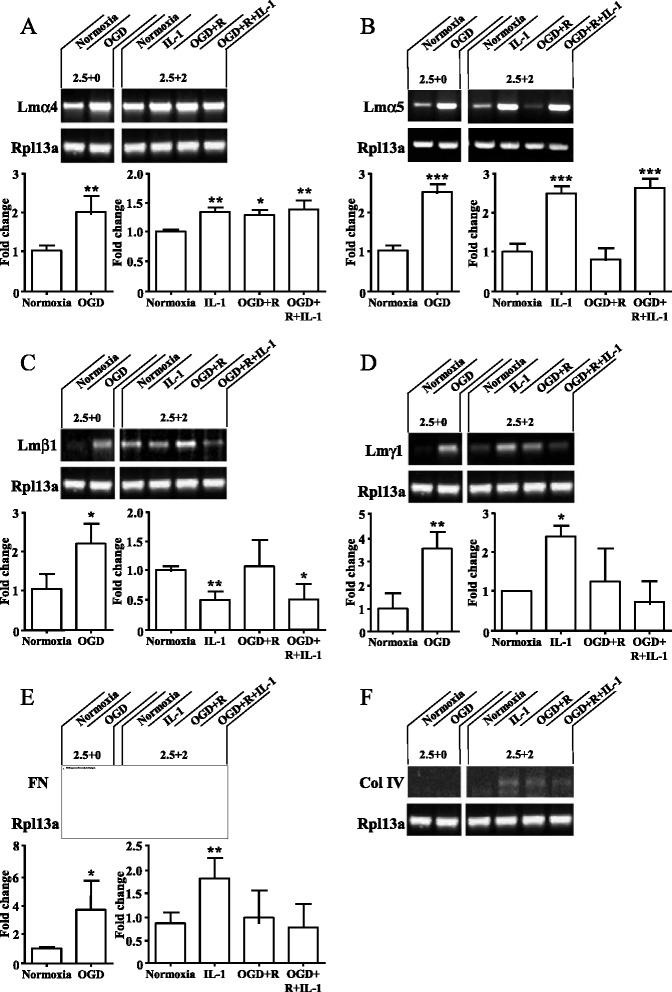
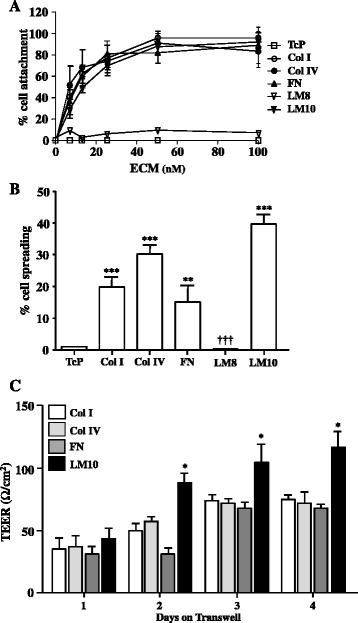
Methods: We used an in vitro model of the BBB, composed of primary rat brain endothelial cells grown on collagen (Col) I-, Col IV-, fibronectin (FN)-, laminin (LM) 8-, or LM10-coated tissue culture plates, either as a single monolayer culture or on Transwell® inserts above mixed glial cell cultures. Cultures were exposed to oxygen-glucose deprivation (OGD) and/or reoxygenation, in the absence or the presence of recombinant interleukin-1β (IL-1β). Cell adhesion to ECM molecules was assessed by cell attachment and cell spreading assays. BBB dysfunction was assessed by immunocytochemistry for tight junction proteins occludin and zona occludens-1 (ZO-1) and measurement of trans-endothelial electrical resistance (TEER). Change in endothelial expression of ECM molecules was assessed by semi-quantitative RT-PCR.
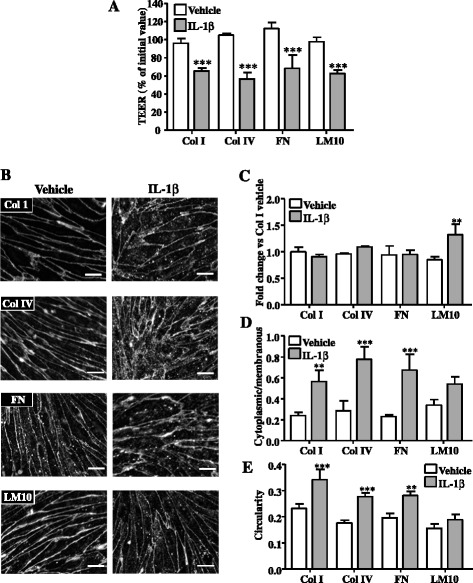
Results: OGD and/or IL-1 induce dramatic changes associated with loss of BBB integrity, including cytoplasmic relocalisation of membrane-associated tight junction proteins occludin and ZO-1, cell swelling, and decreased TEER. OGD and IL-1 also induced gene expression of key ECM molecules associated with the BBB, including FN, Col IV, LM 8, and LM10. Importantly, we found that LM10, but not FN, Col IV, nor LM8, plays a key role in maintenance of BBB integrity and reversed most of the key hallmarks of BBB dysfunction induced by IL-1.
Conclusions: Our data unravel new mechanisms of BBB dysfunction induced by hypoxia and inflammation and identify LM10 as a key ECM molecule involved in BBB repair after hypoxic injury and inflammation.
Figures
Similar articles
-
At low doses ethanol maintains blood-brain barrier (BBB) integrity after hypoxia and reoxygenation: a brain slice study.Neurol Res. 2013 Oct;35(8):790-7. doi: 10.1179/1743132813Y.0000000198. Epub 2013 Apr 12. Neurol Res. 2013. PMID: 23582053
-
Ligustilide Ameliorates the Permeability of the Blood-Brain Barrier Model In Vitro During Oxygen-Glucose Deprivation Injury Through HIF/VEGF Pathway.J Cardiovasc Pharmacol. 2019 May;73(5):316-325. doi: 10.1097/FJC.0000000000000664. J Cardiovasc Pharmacol. 2019. PMID: 30855407
-
Activation of brain endothelial cells by interleukin-1 is regulated by the extracellular matrix after acute brain injury.Mol Cell Neurosci. 2013 Nov;57:93-103. doi: 10.1016/j.mcn.2013.10.007. Epub 2013 Oct 24. Mol Cell Neurosci. 2013. PMID: 24161715
-
The impact of genetic manipulation of laminin and integrins at the blood-brain barrier.Fluids Barriers CNS. 2022 Jun 11;19(1):50. doi: 10.1186/s12987-022-00346-8. Fluids Barriers CNS. 2022. PMID: 35690759 Free PMC article. Review.
-
The role of extracellular matrix alterations in mediating astrocyte damage and pericyte dysfunction in Alzheimer's disease: A comprehensive review.Eur J Neurosci. 2022 Nov;56(9):5453-5475. doi: 10.1111/ejn.15372. Epub 2021 Jul 5. Eur J Neurosci. 2022. PMID: 34182602 Review.
Cited by
-
Isolation of endothelial cells, pericytes and astrocytes from mouse brain.PLoS One. 2019 Dec 18;14(12):e0226302. doi: 10.1371/journal.pone.0226302. eCollection 2019. PLoS One. 2019. PMID: 31851695 Free PMC article.
-
Specific nanoprobe design for MRI: Targeting laminin in the blood-brain barrier to follow alteration due to neuroinflammation.PLoS One. 2024 Apr 11;19(4):e0302031. doi: 10.1371/journal.pone.0302031. eCollection 2024. PLoS One. 2024. PMID: 38603692 Free PMC article.
-
Modeling blood-brain barrier pathology in cerebrovascular disease in vitro: current and future paradigms.Fluids Barriers CNS. 2020 Jul 16;17(1):44. doi: 10.1186/s12987-020-00202-7. Fluids Barriers CNS. 2020. PMID: 32677965 Free PMC article. Review.
-
Roles of blood-brain barrier integrins and extracellular matrix in stroke.Am J Physiol Cell Physiol. 2019 Feb 1;316(2):C252-C263. doi: 10.1152/ajpcell.00151.2018. Epub 2018 Nov 21. Am J Physiol Cell Physiol. 2019. PMID: 30462535 Free PMC article. Review.
-
Enhanced xeno-free differentiation of hiPSC-derived astroglia applied in a blood-brain barrier model.Fluids Barriers CNS. 2019 Aug 29;16(1):27. doi: 10.1186/s12987-019-0147-4. Fluids Barriers CNS. 2019. PMID: 31462266 Free PMC article.
References
-
- Sixt M, Hallmann R, Wendler O, Scharffetter-Kochanek K, Sorokin LM. Cell adhesion and migration properties of beta 2-integrin negative polymorphonuclear granulocytes on defined extracellular matrix molecules. Relevance for leukocyte extravasation. J Biol Chem. 2001;276:18878–18887. doi: 10.1074/jbc.M010898200. - DOI - PubMed
MeSH terms
Substances
LinkOut - more resources
Full Text Sources
Other Literature Sources
Miscellaneous
