Evolutionary dynamics and biogeography of Musaceae reveal a correlation between the diversification of the banana family and the geological and climatic history of Southeast Asia
- PMID: 26832306
- PMCID: PMC5066818
- DOI: 10.1111/nph.13856
Evolutionary dynamics and biogeography of Musaceae reveal a correlation between the diversification of the banana family and the geological and climatic history of Southeast Asia
Abstract
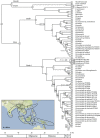
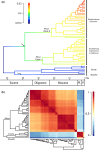
Tropical Southeast Asia, which harbors most of the Musaceae biodiversity, is one of the most species-rich regions in the world. Its high degree of endemism is shaped by the region's tectonic and climatic history, with large differences between northern Indo-Burma and the Malayan Archipelago. Here, we aim to find a link between the diversification and biogeography of Musaceae and geological history of the Southeast Asian subcontinent. The Musaceae family (including five Ensete, 45 Musa and one Musella species) was dated using a large phylogenetic framework encompassing 163 species from all Zingiberales families. Evolutionary patterns within Musaceae were inferred using ancestral area reconstruction and diversification rate analyses. All three Musaceae genera - Ensete, Musa and Musella - originated in northern Indo-Burma during the early Eocene. Musa species dispersed from 'northwest to southeast' into Southeast Asia with only few back-dispersals towards northern Indo-Burma. Musaceae colonization events of the Malayan Archipelago subcontinent are clearly linked to the geological and climatic history of the region. Musa species were only able to colonize the region east of Wallace's line after the availability of emergent land from the late Miocene onwards.
Keywords: Ensete; Musa; Musella; Southeast Asia; ancestral area analysis; dispersal; diversification; historical biogeography.
© 2016 The Authors. New Phytologist © 2016 New Phytologist Trust.
Figures


Similar articles
-
Comparative plastome analysis of Musaceae and new insights into phylogenetic relationships.BMC Genomics. 2022 Mar 21;23(1):223. doi: 10.1186/s12864-022-08454-3. BMC Genomics. 2022. PMID: 35313810 Free PMC article.
-
Molecular phylogeny and systematics of the banana family (Musaceae) inferred from multiple nuclear and chloroplast DNA fragments, with a special reference to the genus Musa.Mol Phylogenet Evol. 2010 Oct;57(1):1-10. doi: 10.1016/j.ympev.2010.06.021. Epub 2010 Jun 30. Mol Phylogenet Evol. 2010. PMID: 20601004
-
Reconstructing the phylogeny and evolutionary history of freshwater fishes (Nemacheilidae) across Eurasia since early Eocene.Elife. 2025 Apr 4;13:RP101080. doi: 10.7554/eLife.101080. Elife. 2025. PMID: 40184190 Free PMC article.
-
Genome assembly of Musa beccarii shows extensive chromosomal rearrangements and genome expansion during evolution of Musaceae genomes.Gigascience. 2022 Dec 28;12:giad005. doi: 10.1093/gigascience/giad005. Epub 2023 Feb 21. Gigascience. 2022. PMID: 36807539 Free PMC article.
-
Visions of the past and dreams of the future in the Orient: the Irano-Turanian region from classical botany to evolutionary studies.Biol Rev Camb Philos Soc. 2017 Aug;92(3):1365-1388. doi: 10.1111/brv.12287. Epub 2016 Jun 28. Biol Rev Camb Philos Soc. 2017. PMID: 27349491 Review.
Cited by
-
Hybridization, missing wild ancestors and the domestication of cultivated diploid bananas.Front Plant Sci. 2022 Oct 7;13:969220. doi: 10.3389/fpls.2022.969220. eCollection 2022. Front Plant Sci. 2022. PMID: 36275535 Free PMC article.
-
A chromosome-level reference genome of Ensete glaucum gives insight into diversity and chromosomal and repetitive sequence evolution in the Musaceae.Gigascience. 2022 Apr 30;11:giac027. doi: 10.1093/gigascience/giac027. Gigascience. 2022. PMID: 35488861 Free PMC article.
-
High-throughput phenotyping reveals differential transpiration behaviour within the banana wild relatives highlighting diversity in drought tolerance.Plant Cell Environ. 2022 Jun;45(6):1647-1663. doi: 10.1111/pce.14310. Epub 2022 Mar 28. Plant Cell Environ. 2022. PMID: 35297073 Free PMC article.
-
Recombination and Large Structural Variations Shape Interspecific Edible Bananas Genomes.Mol Biol Evol. 2019 Jan 1;36(1):97-111. doi: 10.1093/molbev/msy199. Mol Biol Evol. 2019. PMID: 30403808 Free PMC article.
-
Unravelling the complex story of intergenomic recombination in ABB allotriploid bananas.Ann Bot. 2021 Jan 1;127(1):7-20. doi: 10.1093/aob/mcaa032. Ann Bot. 2021. PMID: 32104882 Free PMC article.
References
-
- Argent G. 2000. Two interesting wild Musa (Musaceae) from Sabah, Malaysia. The Gardens’ Bulletin, Singapore 52: 203–210.
-
- Baker RED, Simmonds NW. 1953. The genus Ensete . Kew Bulletin 8: 405–416.
-
- Barrett CF, Davis JI, Leebens‐Mack J, Conran JG, Stevenson DW. 2013. Plastid genomes and deep relationships among the commelinid monocot angiosperms. Cladistics 29: 65–87. - PubMed
-
- Bell CD, Soltis DE, Soltis PS. 2010. The age and diversification of the angiosperm re‐revisited. American Journal of Botany 97: 1296–1303. - PubMed
-
- Bird MI, Taylor D, Hunt C. 2005. Environments of insular Southeast Asia during the last glacial period: a savanna corridor in Sundaland? Quaternary Science Reviews 24: 2228–2242.
Publication types
MeSH terms
LinkOut - more resources
Full Text Sources
Other Literature Sources
Research Materials

