. 2016 Feb 9;14(5):1181-1194.
doi: 10.1016/j.celrep.2015.12.101. Epub 2016 Jan 28.

Nac1 Coordinates a Sub-network of Pluripotency Factors to Regulate Embryonic Stem Cell Differentiation

Affiliations

Nac1 Coordinates a Sub-network of Pluripotency Factors to Regulate Embryonic Stem Cell Differentiation

Mohan Malleshaiah et al. Cell Rep. .

Abstract

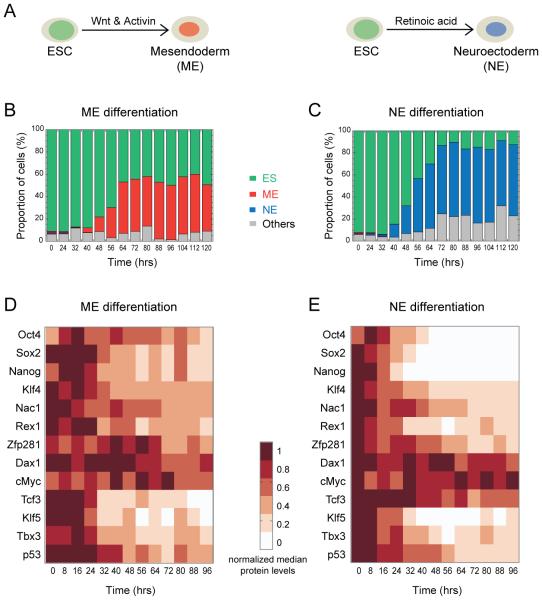
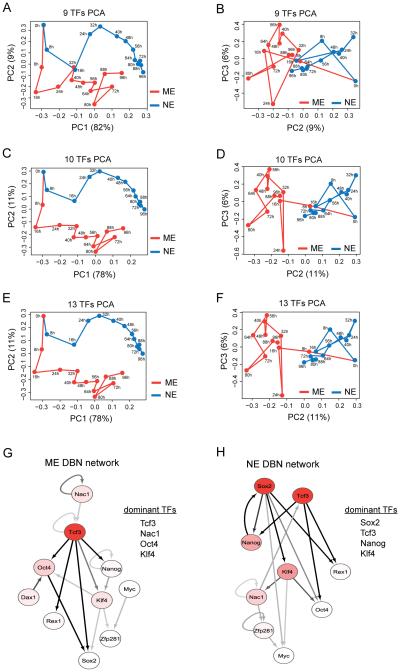
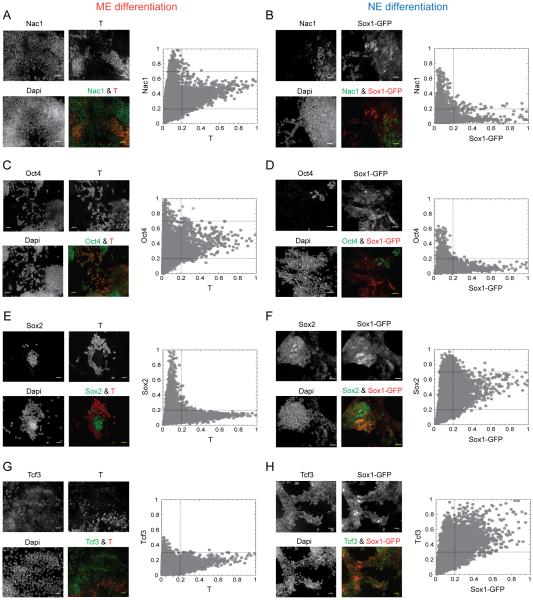
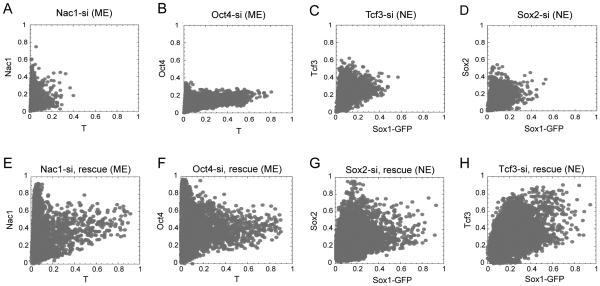
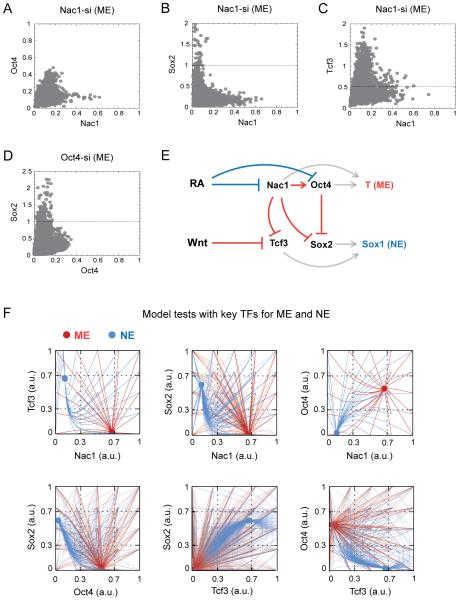
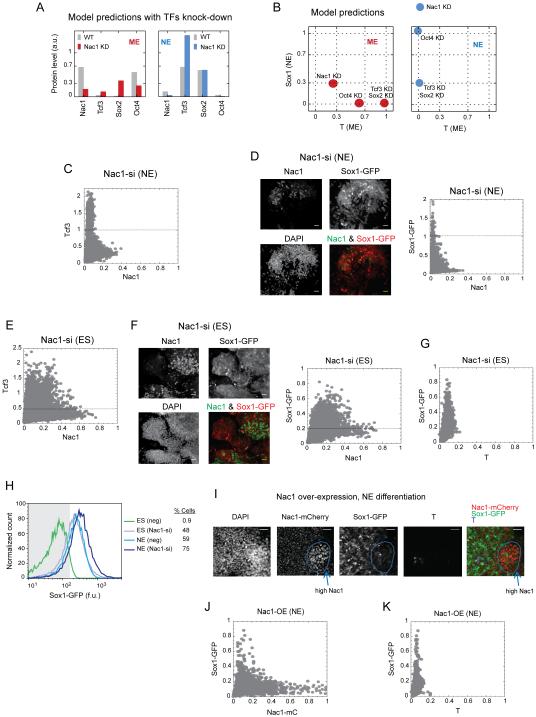
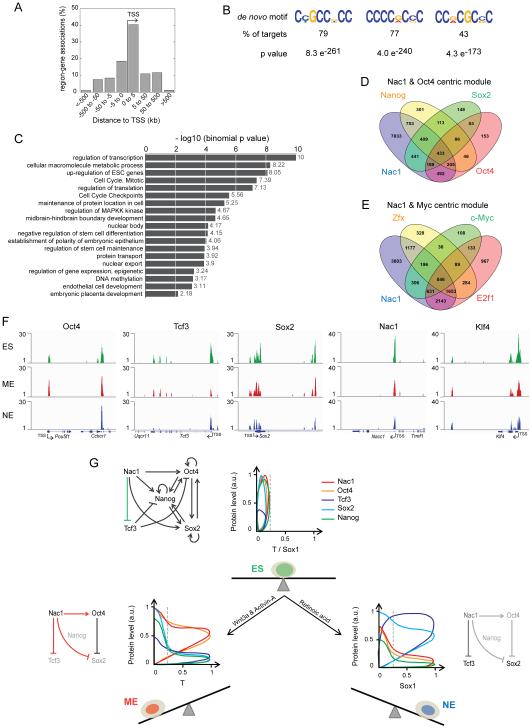
Pluripotent cells give rise to distinct cell types during development and are regulated by often self-reinforcing molecular networks. How such networks allow cells to differentiate is less well understood. Here, we use integrative methods to show that external signals induce reorganization of the mouse embryonic stem cell pluripotency network and that a sub-network of four factors, Nac1, Oct4, Tcf3, and Sox2, regulates their differentiation into the alternative mesendodermal and neuroectodermal fates. In the mesendodermal fate, Nac1 and Oct4 were constrained within quantitative windows, whereas Sox2 and Tcf3 were repressed. In contrast, in the neuroectodermal fate, Sox2 and Tcf3 were constrained while Nac1 and Oct4 were repressed. In addition, we show that Nac1 coordinates differentiation by activating Oct4 and inhibiting both Sox2 and Tcf3. Reorganization of progenitor cell networks around shared factors might be a common differentiation strategy and our integrative approach provides a general methodology for delineating such networks.


Figures

Figure 1
Figure 1. Differentiation-induced changes in the levels of pluripotency factors
Embryonic stem cells (ESC) exit pluripotency to choose between mesendodermal (ME) and neuroectodermal (NE) germ layer precursor fates, guided by Wnt and Activin, and retinoic acid respectively (A) (Gadue et al., 2006; Thomson et al., 2011; Ying et al., 2003). The proportion of cells in the pluripotent (ES), ME, NE and other, undetermined, states at the indicated time points during ESC (Sox1-GFP cell line) differentiation towards the ME (B) and NE (C) fate. Changes in the levels of indicated pluripotency factors during ME (D) and NE (E) differentiation. For each protein, median value (from single cell data) at the indicated time point was normalized to its maximum from the respective differentiation condition. See also Figure S1 and Supplemental Experimental Procedures.
Figure 2
Figure 2. Identification of potential differentiation regulatory TFs by computational analysis
Principal component analysis (PCA) using the median values of nine pluripotency factors - Oct4, Nanog, Sox2, Klf4, Rex1, Nac1, Zfp281, Dax1 and cMyc (A and B) and these nine plus Tcf3 (C and D) for the ME (red) and NE (blue) conditions. PCA with all 13 measured TFs (E and F). Principal component (PC) projections are shown as PC1 vs PC2 and PC2 vs PC3 plots. Dynamic Bayesian Network (DBN) analysis using median values of the ten TFs (above nine plus Tcf3) for ME (G) and NE (H) differentiation. The nodes are colored using a scale based on dominance scores which have been max-normalized for each network separately: white (0.5 and below), red gradient (0.5 to 1) and red (1). The edges are colored using a scale based on their posterior probability predictions with a threshold of 0.25: off-white (0.25), gray scale (0.25 to 0.5) and black (above 0.5). The extent of connectivity measured by dominance scores indicated the top four factors in the ME (G) and NE (H) networks. DBN networks are drawn using Cytoscape. See also Figure S2 and experimental procedures.
Figure 3
Figure 3. Differential regulation of potential TFs in the ME and NE cells
Representative qualitative images (left) and quantitative single cell measurements (right) for Nac1 (A & B), Oct4 (C & D), Sox2 (E & F) and Tcf3 (G & H) in ME and NE differentiation conditions. T and the indicated proteins were quantified by immuno-fluorescence in Sox1-GFP ES cell line. Mean fluorescence intensities of each protein from single cells, normalized as explained in the text, are plotted against the T (ME marker) and Sox1-GFP (NE marker) levels, also normalized, in each panel. Cells were fixed, stained and measurements were done at 72 hrs of differentiation. Dashed lines indicate the division of TF levels into low, medium and high and fate-markers into low and high ranges, as explained in the text. Scale bars represent 35 µm. See also Figures S3 and S4.
Figure 4
Figure 4. Differential requirement of potential TFs for the ME and NE fate choice
Scatter plot for T with Nac1 (A) and Oct4 (B) in cells with siRNA mediated down-regulation of Nac1 and Oct4 respectively during ME differentiation. Scatter plot for Sox1-GFP with Tcf3 (C) and Sox2 (D) in cells with siRNA mediated down-regulation of Tcf3 and Sox2 respectively during NE differentiation. Rescue of Nac1 (E), Oct4 (F) during ME differentiation, and Sox2 (G) and Tcf3 (H) during NE differentiation, following their respective siRNA transfection. A 25 nM pool of siRNAs was used to down-regulate Nac1, Oct4, Tcf3 and Sox2 during the indicated condition. Plasmid bearing the individual TF was co-transfected with siRNA for the rescue experiments in E to H. Cells were transfected 12 hrs prior to addition of differentiation signal. Cells were fixed, stained and measurements were done at 72 hrs of differentiation. Normalization was performed as in Figure 3 but using the maximum levels from mock transfected cells using scrambled siRNA alone (for A to D) or with an empty plasmid (for E to H) under the same experimental conditions. See also Figure S5.
Figure 5
Figure 5. Nac1 coordinates the ME fate selection through Oct4 activation and inhibition of Sox2 and Tcf3
Scatter plots for Nac1 with Oct4 (A), Sox2 (B) and Tcf3 (C), and Oct4 with Sox2 (D) in cells with siRNA-mediated down-regulation of Nac1 and Oct4 respectively during ME differentiation. siRNA transfection, differentiation and normalization were performed as in Figure 4. Dashed lines indicate the expected maximum for a given TF in mock-transfected cells under the ME condition. (E) Schematic of the mathematical model based on experimental data for ESC differentiation into the ME and NE fates. Arrows indicate activation; blunt ends indicate inhibition. Regulations that are shown in red favor ME and those shown in blue favor NE fate choice. While T (ME fate marker) expression was defined by Nac1 and Oct4 levels, Sox1 (NE fate marker) expression was defined by Tcf3 and Sox2 levels (gray arrows). (F) The model simulation results, with chosen parameter values, on varying initial concentrations for each TF and their resulting steady-state levels for ME (red trajectories) and NE (blue trajectories) differentiation. Results are projected as pair-wise combinations among Nac1, Oct4, Sox2 and Tcf3. See also Figure S6 and Supplemental Experimental Procedures.
Figure 6
Figure 6. Nac1 regulates the extent of NE choice and suppresses it in naïve ESCs through Tcf3 inhibition
The model predictions for changes in Nac1, Tcf3, Sox2 and Oct4 levels on partial knock-down (KD) of Nac1 (A), and changes in the ME (T) and NE (Sox1) fate choice (B) upon partial knock-down of indicated protein, during the ME (red) and NE (blue) conditions. Nac1 down-regulation mediated changes in Tcf3, and Sox1-GFP levels during NE differentiation (C and D), under ES condition (E and F), and T and Sox1-GFP levels under ES condition (G). Images show the overlay of Nac1 and Sox1-GFP images at indicated condition. (H) Flow cytometry analysis for Sox1-GFP fluorescence in cells with (Nac1-si) and without (neg) Nac1 down-regulation during pluripotency (ES) and NE conditions. Grey area indicates the cut off used to measure percent of positive (% Cells) Sox1-GFP cells. (I) Images showing the ectopic over-expression of Nac1-mCherry and the extent of Sox1-GFP expression during NE differentiation. DAPI image and image overlays are also shown. Cells over-expressing Nac1-mCherry (Nac1-mC) are highlighted with a blue circle. Scatter plots showing quantitative changes in Nac1-mC and Sox1-GFP (J), and T and Sox1-GFP (K) levels during Nac1 over-expression and NE differentiation. Nac1 down-regulation and normalizations were performed as in Figures 4 & 5. Dashed lines indicate the expected maximum of Tcf3 or Sox1-GFP signal under the indicated condition in mock transfected cells. WT: wild type; neg: negative control (scrambled siRNA); a.u.: arbitrary units; f.u.: fluorescence units. Scale bars represent 35 µm. See also Figures S6 and S7.
Figure 7
Figure 7. Nac1 binds differentially to regulatory gene-regions in ES, ME and NE cells
(A) Percentage of Nac1 bound regions associated to annotated genes of the mouse genome (build mm9) in ESCs. (B) De novo motifs identified from the Nac1 bound target region sequences in ESCs. Three motifs covering the highest percent of targets are shown. (C) Gene ontology and pathway terms enriched among the Nac1 target genes in ESCs. Data are shown graphically according to their p values (x axis) and the associated functional category (y axis). Comparison of Nac1 target genes with those of Oct4 centric module TFs – Oct4, Sox2 and Nanog (D), and the Myc centric module TFs – E2f1, c-Myc and Zfx (E). (F) Genome tracks showing Nac1 binding enrichment peaks detected at Oct4, Tcf3, Sox2, Nac1 and Klf4 regions, from ChIP-seq analysis in ES, ME and NE cells. Gene locus, TSS and the transcription orientation are indicated for each target. See also Figure S7 and Experimental Procedures. (G) The regulations among the key TFs – Nac1, Oct4, Sox2, Tcf3 and Nanog – may robustly maintain the mutually balanced ESC state (above). Single cell quantitative pattern of Nac1 (red), Oct4 (orange), Tcf3 (blue), Sox2 (cyan) and Nanog (green) protein levels with respect to T (ME fate marker) and Sox1 (NE fate marker) levels are shown, beside the sub-network schematics, for ES, ME and NE cells. The ES sub-network is updated to include Nac1 mediated Tcf3 inhibition. The balanced ES state (green cell) and its imbalance induced by indicated differentiation signals to favor either the ME (red cell) or the NE (blue cell) fate are shown. Dashed line indicates the threshold signal used to regard a cell as T or Sox1 positive. Arrows indicate activation and blunt ends indicate inhibition. Proteins and relationships shown in light gray are under repression. Residual levels of Nac1 and its inhibition of Tcf3 in NE cells are shown in dark gray (below right).

References

    1. Atlasi Y, Noori R, Gaspar C, Franken P, Sacchetti A, Rafati H, Mahmoudi T, Decraene C, Calin GA, Merrill BJ, et al. Wnt signaling regulates the lineage differentiation potential of mouse embryonic stem cells through Tcf3 down-regulation. PLoS genetics. 2013;9:e1003424. - PMC - PubMed
    1. Bendall SC, Simonds EF, Qiu P, Amirel AD, Krutzik PO, Finck R, Bruggner RV, Melamed R, Trejo A, Ornatsky OI, et al. Single-cell mass cytometry of differential immune and drug responses across a human hematopoietic continuum. Science. 2011;332:687–696. - PMC - PubMed
    1. Bouwman P, Philipsen S. Regulation of the activity of Sp1-related transcription factors. Molecular and cellular endocrinology. 2002;195:27–38. - PubMed
    1. Carpenter AE, Jones TR, Lamprecht MR, Clarke C, Kang IH, Friman O, Guertin DA, Chang JH, Lindquist RA, Moffat J, et al. CellProfiler: image analysis software for identifying and quantifying cell phenotypes. Genome biology. 2006;7:R100. - PMC - PubMed
    1. Chen X, Xu H, Yuan P, Fang F, Huss M, Vega VB, Wong E, Orlov YL, Zhang W, Jiang J, et al. Integration of external signaling pathways with the core transcriptional network in embryonic stem cells. Cell. 2008;133:1106–1117. - PubMed

Publication types

MeSH terms

LinkOut - more resources