. 2016 Mar;15(3):503-11.
doi: 10.1158/1535-7163.MCT-15-0548-T. Epub 2016 Feb 1.

EGFR Is Regulated by TFAP2C in Luminal Breast Cancer and Is a Target for Vandetanib

Affiliations

EGFR Is Regulated by TFAP2C in Luminal Breast Cancer and Is a Target for Vandetanib

James P De Andrade et al. Mol Cancer Ther. 2016 Mar.

Abstract

Expression of TFAP2C in luminal breast cancer is associated with reduced survival and hormone resistance, partially explained through regulation of RET. TFAP2C also regulates EGFR in HER2 breast cancer. We sought to elucidate the regulation and functional role of EGFR in luminal breast cancer. We used gene knockdown (KD) and treatment with a tyrosine kinase inhibitor (TKI) in cell lines and primary cancer isolates to determine the role of RET and EGFR in regulation of p-ERK and tumorigenesis. KD of TFAP2C decreased expression of EGFR in a panel of luminal breast cancers, and chromatin immunoprecipitation sequencing (ChIP-seq) confirmed that TFAP2C targets the EGFR gene. Stable KD of TFAP2C significantly decreased cell proliferation and tumor growth, mediated in part through EGFR. While KD of RET or EGFR reduced proliferation (31% and 34%, P < 0.01), combined KD reduced proliferation greater than either alone (52% reduction, P < 0.01). The effect of the TKI vandetanib on proliferation and tumor growth response of MCF-7 cells was dependent upon expression of TFAP2C, and dual KD of RET and EGFR eliminated the effects of vandetanib. The response of primary luminal breast cancers to TKIs assessed by ERK activation established a correlation with expression of RET and EGFR. We conclude that TFAP2C regulates EGFR in luminal breast cancer. Response to vandetanib was mediated through the TFAP2C target genes EGFR and RET. Vandetanib may provide a therapeutic effect in luminal breast cancer, and RET and EGFR can serve as molecular markers for response.


Conflict of interest statement

CONFLICT OF INTEREST: The authors declare that they have no conflict of interest.

Figures

Figure 1
Figure 1. TFAP2C Regulates EGFR in Luminal Breast Cancer and Enhances Cell Viability
A. Expression of EGFR RNA and protein is shown for MCF-7, ZR-75-1 and T-47D luminal breast cancer lines with knockdown of TFAP2C (C) compared to non-targeting (NT) siRNA at 96 hours after transfection. B. ChIP-seq data from Woodfield et al.(6), reported in GEO Series accession number GSE21234. C. Stable MCF-7 cell clones established with shRNAs to TFAP2C (sKD-C) or non-targeting shRNA (sKD-NT) were evaluated for expression of TFAP2C and EGFR RNA (top) and protein (bottom); * p<0.05. D. Relative viability of sKD-C cells compared to sKD-NT; p<0.05. E. Relative viability of MCF-7 cells following transient knockdown of TFAP2C (C) compared to non-targeting (NT) siRNA. Expression of TFAP2C and relative viability with knockdown of TFAP2C (C) compared to non-targeting (NT) siRNA transfection in ZR-75-1 (F) and T-47D (G).
Figure 2
Figure 2. TFAP2C Regulates Tumor Growth and Proliferative Index
A. Volume of tumor xenografts comparing sKD-C and sKD-NT cells, N=8 mice per group. B. Average tumor volume compared at day 15 from data in A; * p=0.006. C. Immunohistochemistry for Ki-67 and CC3 of tumor xenografts from sKD-NT and sKD-C cells as indicated with quantitative differences shown in graphic form at the right; *p<0.05, NS: not significant.
Figure 3
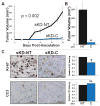
Figure 3. EGFR Regulates Tumor Growth and Progression
A. Tumor-free survival of mice inoculated with MCF-7 cells transfected with siRNA to EGFR (siEGFR) vs. non-targeting (NT); N=7 mice. B. Tumor free survival at day 5 post-inoculation (time when all siNT had tumors) showing significant difference between NT and EGFR siRNA transfected cells. C. Average tumor volume for all animals inoculated with NT or EGFR siRNA transfected cells. D. Average tumor volume at 12 days post-inoculation for experiment shown in C; * p = 0.002.
Figure 4
Figure 4. Additive Effects of RET and EGFR in ERK Activation and Cell Viability
In all top panels, western blots show expression of TFAP2C, RET, EGFR, ERK, p-ERK and GAPDH after transfection with siRNA to NT, RET, EGFR or both EGFR and RET (R+E) in MCF-7 (A), ZR-75-1 (B) and T-47D (C). The relative level of p-ERK compared to NT with knockdown of RET, EGFR and R+E for MCF-7 cells: 66%, 7%, 4%; for ZR-75-1: 61%, 45% 15%; for T-47D: 57%, 40%, 36%. Bottom panels show parallel assessment of cell viability for all three cell lines with knockdown of RET and EGFR or both RTKs as indicated; * p<0.01.
Figure 5
Figure 5. Role of RET and EGFR in Response to Vandetanib
A. Relative viability of MCF-7 cells after knockdown of RET, EGFR or both RTKs (R+E) without treatment (Vehicle) (From figure 4A, bottom panel) or with vandetanib treatment (VAN) for 24 hours prior to harvest. B. Tumor volume of sKD-NT (black) and sKD-C (blue) xenografts with vandetanib treatment or without vandetanib treatment (from figure 2A). C. Tumor volume (mm3) at day 15 for experiment shown in B; * p<0.05, NS: non significant. D. Immunohistochemistry of xenografts stained for Ki-67 for experiment shown in C. Quantitative results of relative Ki-67 for xenografts from sKD-NT (black) and sKD-C (blue) xenografts; * p<0.05.
Figure 6
Figure 6. RET and EGFR Expression in Breast Cancer Samples and Response to TKI therapy
A. H&E and immunohistochemistry of three luminal A primary human breast cancers stained for expression of RET and EGFR show expression of both RTKs. B. Western blots for total ERK, p-ERK and GAPDH demonstrate the change in p-ERK expression of nine breast tumor tissue after treatment with vehicle control (CTL), vandetanib (VAN), or PD153035 (PD). C. Plot of relative RET and EGFR expression in nine primary breast cancers relative to MCF-7. Color of circle indicates relative response to treatment with vandetanib (yellow) or PD (blue). Grey indicates no response to RTK; X and Y-axes are logarithmic. D. Table summarizes relative decrease in p-ERK compared to control treatment based on densitometer analysis of western blots in B; NC: no change.

References

    1. Siegel R, Naishadham D, Jemal A. Cancer statistics, 2013. CA Cancer J Clin. 2013;63:11–30. - PubMed
    1. Sorlie T, Perou CM, Tibshirani R, Aas T, Geisler S, Johnsen H, et al. Gene expression patterns of breast carcinomas distinguish tumor subclasses with clinical implications. Proceedings of the National Academy of Sciences of the United States of America. 2001;98:10869–74. - PMC - PubMed
    1. Bogachek MV, Chen Y, Kulak MV, Woodfield GW, Cyr AR, Park JM, et al. Sumoylation pathway is required to maintain the Basal breast cancer subtype. Cancer Cell. 2014;25:748–61. - PMC - PubMed
    1. Cyr AR, Kulak MV, Park JM, Bogachek MV, Spanheimer PM, Woodfield GW, et al. TFAP2C governs the luminal epithelial phenotype in mammary development and carcinogenesis. Oncogene. 2015;34:436–44. - PMC - PubMed
    1. Woodfield GW, Horan AD, Chen Y, Weigel RJ. TFAP2C controls hormone response in breast cancer cells through multiple pathways of estrogen signaling. Cancer Research. 2007;67:8439–43. - PubMed

Publication types

MeSH terms