. 2016 Mar 8;23(3):492-504.
doi: 10.1016/j.cmet.2016.01.001. Epub 2016 Jan 28.

Intestinal Phospholipid Remodeling Is Required for Dietary-Lipid Uptake and Survival on a High-Fat Diet

Affiliations

Intestinal Phospholipid Remodeling Is Required for Dietary-Lipid Uptake and Survival on a High-Fat Diet

Bo Wang et al. Cell Metab. .

Abstract

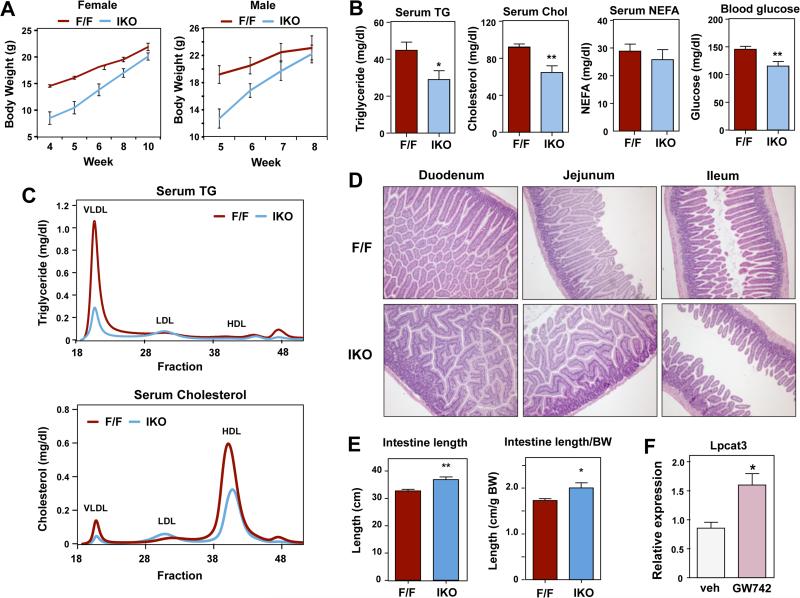
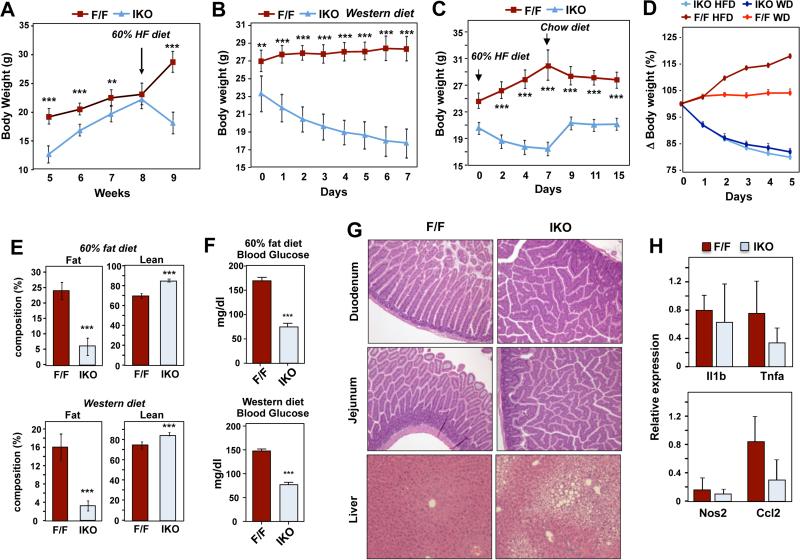
Phospholipids are important determinants of membrane biophysical properties, but the impact of membrane acyl chain composition on dietary-lipid absorption is unknown. Here we demonstrate that the LXR-responsive phospholipid-remodeling enzyme Lpcat3 modulates intestinal fatty acid and cholesterol absorption and is required for survival on a high-fat diet. Mice lacking Lpcat3 in the intestine thrive on carbohydrate-based chow but lose body weight rapidly and become moribund on a triglyceride-rich diet. Lpcat3-dependent incorporation of polyunsaturated fatty acids into phospholipids is required for the efficient transport of dietary lipids into enterocytes. Furthermore, loss of Lpcat3 amplifies the production of gut hormones, including GLP-1 and oleoylethanolamide, in response to high-fat feeding, contributing to the paradoxical cessation of food intake in the setting of starvation. These results reveal that membrane phospholipid composition is a gating factor in passive lipid absorption and implicate LXR-Lpcat3 signaling in a gut-brain feedback loop that couples absorption to food intake.


Figures

Figure 1
Figure 1. Reduced plasma triglyceride and cholesterol levels in intestine-specific Lpcat3 knockout mice
(A) Growth curve of Lpcat3fl/fl (F/F) and Lpcat3fl/fl Villin-Cre (IKO) mice on chow diet after weaning (n≥6/group). (B) Plasma lipid and glucose levels in 8-10 week old chow-diet fed Lpcat3fl/fl (F/F) and Lpcat3fl/fl Villin-Cre (IKO) mice (n≥6/group). Mice were fasted for 6 h before blood collection. (C) Lipoprotein profiles of Lpcat3fl/fl (F/F) and Lpcat3fl/fl Villin-Cre (IKO) mice. Plasma from F/F and IKO mice was pooled (n=5) and analyzed by fast protein liquid chromatography (FPLC). (D) Hematoxylin and eosin (H&E) staining of intestine sections from Lpcat3fl/fl (F/F) and Lpcat3fl/fl Villin-Cre (IKO) mice. (E) Small intestine length of Lpcat3fl/fl (F/F) and Lpcat3fl/fl Villin-Cre (IKO) mice (n≥6/group). (F) Induction of Lpcat3 mRNA expression in intestines of mice treated with 20 mg/kg/day GW742 by oral gavage for 5 days (n=5/group). Gene expression was measured by real-time PCR. Values are means ± SEM. Statistical analysis was performed with Student's t test. *p < 0.05; **p < 0.01.
Figure 2
Figure 2. Mice lacking Lpcat3 cannot survive on high-fat diet or Western diet
(A-B) Growth curve of male Lpcat3fl/fl (F/F) and Lpcat3fl/fl Villin-Cre (IKO) mice placed on chow diet after weaning and then switched to 60% high-fat diet (HFD) (A) (n≥6/group), or Western diet (B) (n≥4/group). (C) Growth curve of female Lpcat3fl/fl (F/F) and Lpcat3fl/fl Villin-Cre (IKO) mice on 60% HFD for 7 days and switched back to chow diet (n≥4/group). (D) Body weight change in 60% HFD and western diet fed mice (n≥4/group). (E) Body composition of Lpcat3fl/fl (F/F) and Lpcat3fl/fl Villin-Cre (IKO) mice on 60% HFD for 10 days (n≥6/group) and Western diet for 8 days (n≥4/group). (F) Blood glucose levels in Lpcat3fl/fl (F/F) and Lpcat3fl/fl Villin-Cre (IKO) mice on 60% HFD and Western Diet as in (D). (G) H&E staining of intestine and liver sections from Lpcat3fl/fl (F/F) and Lpcat3fl/fl Villin-Cre (IKO) mice on 60% HFD for 10 days. (H) Expression of inflammatory genes in fasting and 60% HFD refed intestines measured by real-time PCR (n≥4/group). Values are means ± SEM. Statistical analysis was performed with two-way ANOVA (A-D) and Student's t test (E, F and H). *p < 0.05, **p < 0.01, *** p<0.001.
Figure 3
Figure 3. Triglyceride-rich diets inhibit feeding in Lpcat3 IKO mice
(A-B) Daily food intake in male Lpcat3fl/fl (F/F) and Lpcat3fl/fl Villin-Cre (IKO) mice on chow diet (A) and 60% HFD (B). (C) Growth curve of male Lpcat3fl/fl (F/F), Lpcat3fl/fl Villin-Cre (IKO) and pair feeding Lpcat3fl/fl (F/F PF) mice (n≥5/group). (D) Blood glucose levels in mice as in (D). (E) Food preference test in female Lpcat3fl/fl (F/F), Lpcat3fl/fl Villin-Cre (IKO) during fasting/refeeding. Mice were fasted overnight and provided with both 60% HFD and chow diet. Food intake was monitored for 24 h (n≥5/group). (F) ELISA analysis of active GLP-1, PYY and CCK in the plasma of Lpcat3fl/fl (F/F) and Lpcat3fl/fl Villin-Cre (IKO) mice fasted overnight and refed 60% HFD for 2 h (n≥5/group). (G) Food intake in Lpcat3fl/fl (F/F) and Lpcat3fl/fl Villin-Cre (IKO) mice treated with vehicle or GLP-1 receptor antagonist Ex-9 (n=3/group). Mice were fed 60% HFD and i.p. injected with Ex-9 (5 μg/25 g BW, twice/day) for 5 days. (H) Mass spectrometry analysis of OEA in the serum and jejunum of mice fasted overnight and refed 60% HFD (n≥4/group). Results from two independent experiments are shown. Values are means ± SEM. Statistical analysis was performed with two-way ANOVA (AC, E and G-J), one-way ANOVA (D), and Student's t test (F, and H). *p < 0.05; **p < 0.01, *** p<0.001, ns, not significant.
Figure 4
Figure 4. Lpcat3 IKO mice are protected from diet-induced obesity
(A) Average food intake in male Lpcat3fl/fl (F/F) and Lpcat3fl/fl Villin-Cre (IKO) mice after week 1 and week 8 of 30% fat diet feeding (n≥5/group). (B) Growth curve of Lpcat3fl/fl (F/F) and Lpcat3fl/fl Villin-Cre (IKO) mice on 30% fat diet. (C-D) Glucose tolerance tests (GTT) performed Lpcat3fl/fl (F/F) and Lpcat3fl/fl Villin-Cre (IKO) mice before 30% fat feeding (chow diet) (C) and after feeding 30% fat diet for 17 weeks (D). (E) Fecal production in Lpcat3fl/fl (F/F) and Lpcat3fl/fl Villin-Cre (IKO) mice during week 8 of 30% fat diet feeding. (F) Fecal lipid levels and lipid absorption coefficient in Lpcat3fl/fl (F/F) and Lpcat3fl/fl Villin-Cre (IKO) mice during week 8 of 30% fat diet feeding. (G-H) Total biliary bile acid (BA) levels and species composition in chow diet fed Lpcat3fl/fl (F/F) and Lpcat3fl/fl Villin-Cre (IKO) (n≥6/group). Values are means ± SEM. Statistical analysis was performed with Student's t test (A, E and F), and two-way ANOVA (C-D). *p < 0.05; **p < 0.01.
Figure 5
Figure 5. Impaired triglyceride absorption in Lpcat3 IKO mice
(A) Postprandial TG response in male Lpcat3fl/fl (F/F) and Lpcat3fl/fl Villin-Cre (IKO) mice after oral gavage with olive oil (10 μl/g BW) (n=6/group). (B) Plasma lipid levels in chow diet fed male Lpcat3fl/fl (F/F) and Lpcat3fl/fl Villin-Cre (IKO) mice after fasting overnight and refeeding 60% HFD for 2 h. (n≥4/group) (C) H&E staining of intestine sections from Lpcat3fl/fl (F/F) and Lpcat3fl/fl Villin-Cre (IKO) mice as in (C). (D) Fluorescence images of small intestines of Lpcat3fl/fl (F/F) and Lpcat3fl/fl Villin-Cre (IKO) mice, and wild-type C57BL/6 and Cd36−/− mice after oral gavage with olive oil containing BODIPY-labeled fatty acid for 2 h. (E) Distribution of radioactivity in intestinal segments of male Lpcat3fl/fl (F/F) and Lpcat3fl/fl Villin-Cre (IKO) mice after an oral challenge of olive oil containing 14C-trioleoylglycerol for 2 h (n=3/group). (F) Ex vivo glucose uptake assay in Lpcat3fl/fl (F/F) and Lpcat3fl/fl Villin-Cre (IKO) intestines (n=3/group). (G) In vivo cholesterol absorption measured by fecal dual isotope ratio method (n=4/group). Values are means ± SEM. Statistical analysis was performed with two-way ANOVA (A and G) and Student's t test (B and F). *p < 0.05; **p < 0.01.
Figure 6
Figure 6. Loss of Lpcat3 in intestine impairs chylomicron lipidation and secretion
(A) Plasma chylomicron particle size in Lpcat3fl/fl (F/F) and Lpcat3fl/fl Villin-Cre (IKO) mice. Mice were fasted overnight and refed 60% HFD for 2 h. Chylomicrons were isolated and pooled from 5 mice/group. Chylomicrons were stained with 2.0% uranyl acetate and visualized by electron microscopy. (B) Quantification of chylomicron particle size in (A). (C) Representative pictures of plasma collected from Lpcat3fl/fl (F/F) and Lpcat3fl/fl Villin-Cre (IKO) mice as in (A). (D) ApoB western blot in chylomicron, whole serum and duodenum of Lpcat3fl/fl (F/F) and Lpcat3fl/fl Villin-Cre (IKO) mice as in (A). (E-F) Gene expression in jejunum of Lpcat3fl/fl (F/F) and Lpcat3fl/fl Villin-Cre (IKO) mice during fasting (E) and 60% HFD refeeding (F) mice (n≥4/group). Values are means ± SEM. Statistical analysis was performed with Student's t test. *p < 0.05; **p < 0.01.
Figure 7
Figure 7. Lpcat3 deficiency impairs linoleate incorporation and reduces enterocyte membrane dynamics
(A) ESI-MS/MS analysis of the abundance of PC species in enterocytes from male Lpcat3fl/fl (F/F) and Lpcat3fl/fl Villin-Cre (IKO) mice fed 60% HFD for 5 days (n ≥ 5/group). (B) Electron microscopy analysis of microvilli of enterocytes from Lpcat3fl/fl (F/F) and Lpcat3fl/fl Villin-Cre (IKO) mice. (C) Laurdan imaging of enterocyte membrane dynamics. Duodenum from male Lpcat3fl/fl (F/F) and Lpcat3fl/fl Villin-Cre (IKO) mice were stained with laurdan. The laurdan emission spectrum was captured by a 2-photon laser-scan microscope. Generalized polarization (GP) was calculated from the emission intensities obtained from images. Higher GP value indicates that membranes are more ordered and less dynamic. The GP value of each pixel was used to generate a pseudocolor GP image. The binary histograms of the GP distribution of the GP images were quantified at the bottom (n = 4). (D) Ex vivo fatty acid uptake in duodenum of male Lpcat3fl/fl (F/F) and Lpcat3fl/fl Villin-Cre (IKO) mice at room temperature. Mice were fasted for 4 h followed by fatty acid uptake assay as described in the methods (n=5/group). (E) Ex vivo fatty acid uptake in duodenum treated with 16:0; 18:0 PC (control) and 16:0, 20:4 PC at room temperature (n=4/group). (F) Ex vivo glucose uptake in duodenum of male Lpcat3fl/fl (F/F) and Lpcat3fl/fl Villin-Cre (IKO) mice treated with 16:0; 18:0 PC (control) and 16:0, 20:4 PC (n=4/group) at room temperature (n=5/group). (G) Ex vivo fatty acid uptake in duodenum of female Lpcat3fl/fl (F/F) and Lpcat3fl/fl Villin-Cre (IKO) mice at 0°C on ice (n=3/group). (H) Ex vivo fatty acid uptake in duodenum treated with 16:0; 18:0 PC (control) and 16:0, 20:4 PC at 4°C on ice (n=3/group). Values are means ± SEM. Statistical analysis was performed with Student's t test (A and G), one-way ANOVA (E and H) and two-way ANOVA (D and F). *p < 0.05; **p < 0.01; ***p<0.001.

References

    1. Abumrad NA, Davidson NO. Role of the gut in lipid homeostasis. Physiol Rev. 2012;92:1061–1085. - PMC - PubMed
    1. Begg DP, Woods SC. The endocrinology of food intake. Nat Rev Endocrinol. 2013;9:584–597. - PubMed
    1. Brunaldi K, Huang N, Hamilton JA. Fatty acids are rapidly delivered to and extracted from membranes by methyl-beta-cyclodextrin. J Lipid Res. 2010;51:120–131. - PMC - PubMed
    1. Camilleri M. Peripheral mechanisms in appetite regulation. Gastroenterology. 2015;148:1219–1233. - PMC - PubMed
    1. Chen M, Yang Y, Braunstein E, Georgeson KE, Harmon CM. Gut expression and regulation of FAT/CD36: possible role in fatty acid transport in rat enterocytes. Am J Physiol Endocrinol Metab. 2001;281:E916–923. - PubMed

Publication types

MeSH terms