. 2016 Feb 17;89(4):734-40.
doi: 10.1016/j.neuron.2015.12.038. Epub 2016 Jan 28.

Pathway-Specific Remodeling of Thalamostriatal Synapses in Parkinsonian Mice

Affiliations

Pathway-Specific Remodeling of Thalamostriatal Synapses in Parkinsonian Mice

Philip R L Parker et al. Neuron. .

Abstract

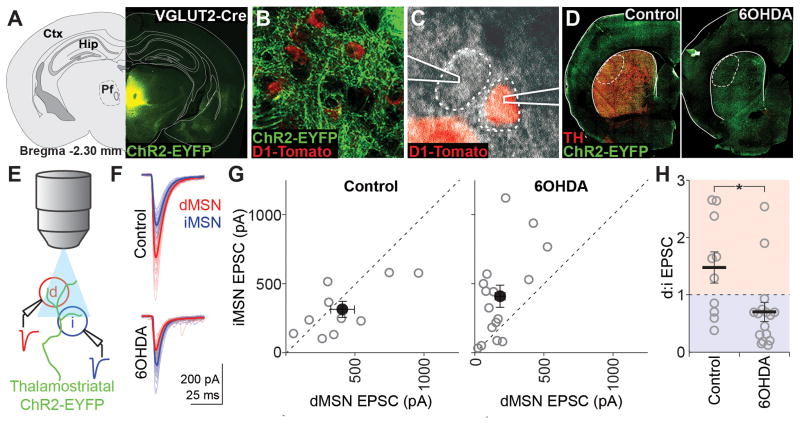
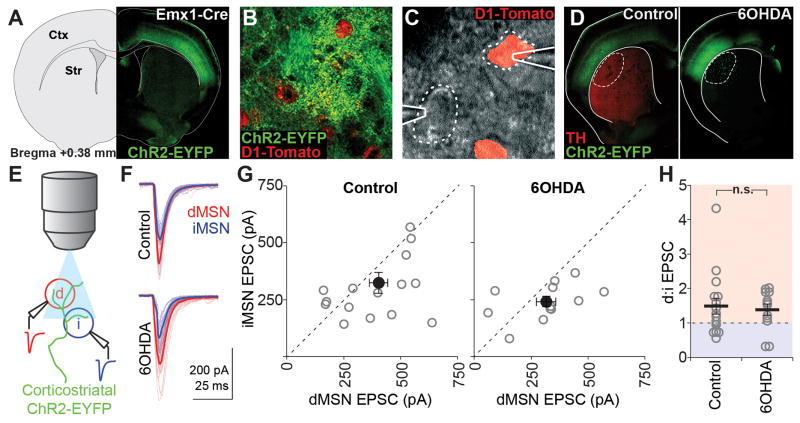
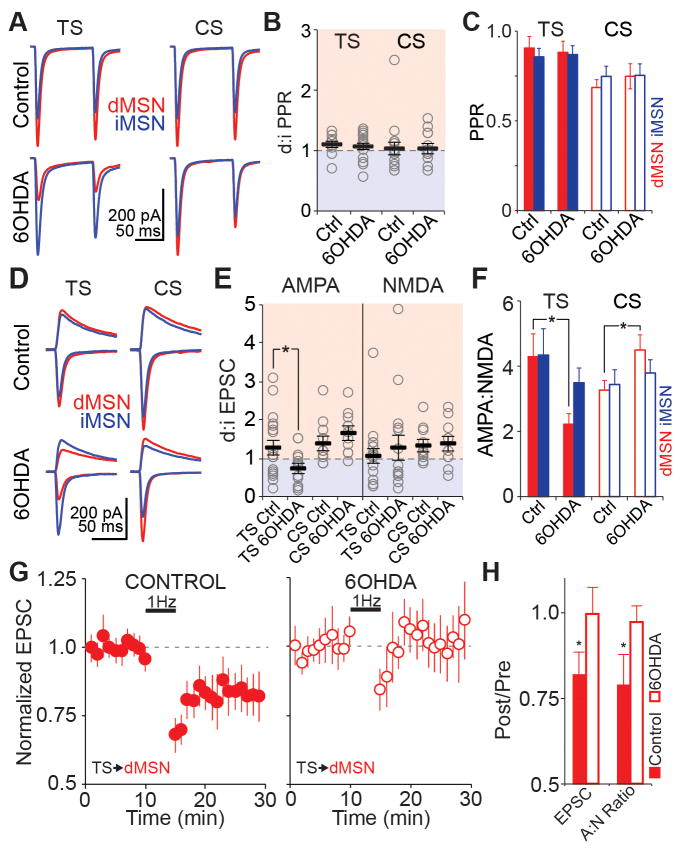
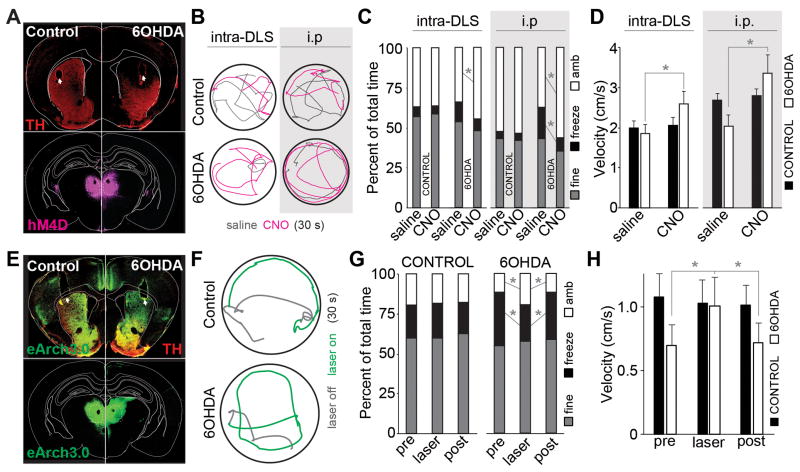
Movement suppression in Parkinson's disease (PD) is thought to arise from increased efficacy of the indirect pathway basal ganglia circuit, relative to the direct pathway. However, the underlying pathophysiological mechanisms remain elusive. To examine whether changes in the strength of synaptic inputs to these circuits contribute to this imbalance, we obtained paired whole-cell recordings from striatal direct- and indirect-pathway medium spiny neurons (dMSNs and iMSNs) and optically stimulated inputs from sensorimotor cortex or intralaminar thalamus in brain slices from control and dopamine-depleted mice. We found that dopamine depletion selectively decreased synaptic strength at thalamic inputs to dMSNs, suggesting that thalamus drives asymmetric activation of basal ganglia circuitry underlying parkinsonian motor impairments. Consistent with this hypothesis, in vivo chemogenetic and optogenetic inhibition of thalamostriatal terminals reversed motor deficits in dopamine-depleted mice. These results implicate thalamostriatal projections in the pathophysiology of PD and support interventions targeting thalamus as a potential therapeutic strategy.


Figures

Figure 1
Figure 1. Dopamine depletion selectively reduces thalamic input to dMSNs
(A) AAV-DIO-ChR2-EYFP expression targeting intralaminar thalamus in VGLUT2-cre x D1-Tomato mice. Ctx, cortex; Hip, hippocampus; Pf, parafascicular nucleus. (B) ChR2-EYFP+ axons in the DLS surrounding D1-Tomato+ dMSNs. (C) DIC image of simultaneous patch-clamp recordings from one D1-Tomato+ and one D1-Tomato− MSN. (D) Epifluorescence image of ChR2-EYFP and tyrosine hydroxylase (TH) expression in coronal sections containing the DLS of saline- (control) and 6OHDA-injected animals. Recordings were obtained within the dotted region. (E) Schematic of recording setup: whole-cell responses to thalamostriatal stimulation evoked by 470nm LED pulses through the objective were recorded simultaneously from one dMSN (red) and one iMSN (blue). (F) Example traces from a pair of MSNs in a control and 6OHDA-lesioned animal. Thick traces are averages and thin traces are individual sweeps. (G) Individual (grey) and mean (black) values for dMSN and iMSN EPSC amplitudes for all recorded pairs in control (left, n=10 pairs) and 6OHDA-lesioned (right, n=16 pairs) animals. (H) Pairwise ratios of dMSN and iMSN EPSC amplitudes in control and 6OHDA-lesioned animals. Points above 1 (red shading) represent dMSN-favored pairs and points below 1 (blue shading) represent iMSN-favored pairs. All summary data are mean ± SEM. Asterisk is p=0.016.
Figure 2
Figure 2. Maintenance of relative corticostriatal drive after dopamine depletion
(A) AAV-DIO-ChR2-EYFP expression targeting sensorimotor cortex in Emx1-cre x D1-Tomato mice. Ctx, cortex; Str, striatum. (B) ChR2-EYFP+ axons in the DLS surrounding D1-Tomato+ dMSNs. (C) DIC image of simultaneous patch-clamp recordings from one D1-Tomato+ and one D1-Tomato− MSN. (D) Epifluorescence image of ChR2-EYFP and tyrosine hydroxylase (TH) expression in coronal sections containing the DLS of saline- (control) and 6OHDA-injected animals. Recordings were obtained within the dotted region. (E) Schematic of recording setup: whole-cell responses to corticostriatal stimulation evoked by 470nm LED pulses through the objective were recorded simultaneously from one dMSN (red) and one iMSN (blue). (F) Example traces from a pair of MSNs in a control and a 6OHDA-lesioned animal. Thick traces are averages and thin traces are individual sweeps. (G) Individual (grey) and mean (black) values for dMSN and iMSN EPSC amplitudes for all recorded pairs in control (left, n=16 pairs) and 6OHDA-lesioned (right, n=12 pairs) animals. (H) Pairwise ratios of dMSN and iMSN EPSC amplitudes in control and 6OHDA-lesioned animals. All summary data are mean ± SEM; n.s. is not significant.
Figure 3
Figure 3. Selective reduction in postsynaptic AMPAR-mediated currents at thalamo-dMSN synapses in parkinsonian animals
(A) Averaged traces from all dMSN (red) and iMSN (blue) pairs showing thalamostriatal (TS) and corticostriatal (CS) responses in control and 6OHDA-lesioned animals. For each individual pair, the paired pulse ratio (PPR) was calculated as EPSC2/EPSC1. (B) d:iMSN ratio of PPR at TS (left) and CS (right) synapses. Gray circles are individual pairs, black bars are group means. TS control n=10, TS 6OHDA n=16, CS control n=16, CS 6OHDA n=12. (C) Unpaired data showing average PPR at TS (filled bars) and CS (open bars) synapses for dMSNs and iMSNs in control (Ctrl) and 6OHDA-lesioned animals. All summary data are presented as mean ± SEM. TS control n=10, TS 6OHDA n=16, CS control n=16, CS 6OHDA n=12. (D) Averaged traces from all dMSN (red) and iMSN (blue) pairs showing TS and CS responses in control and 6OHDA-lesioned animals. For each pair, lower traces were recorded at −80 mV (AMPA) and upper traces were recorded at +40 mV (NMDA, calculated 50 ms post-stimulus). (E) d:iMSN ratio of AMPA (left) and NMDA (right) currents at TS and CS synapses. Gray circles are individual pairs, black bars are group means. TS control n=18, TS 6OHDA n=15, CS control n=10, CS 6OHDA n=10. Asterisk is p=0.026. (F) Unpaired data showing average values of AMPA:NMDA ratios at TS (filled bars) and CS (open bars) synapses for dMSNs and iMSNs in control (Ctrl) and 6OHDA-lesioned animals. TS control n=18, TS 6OHDA n=16, CS control n=13, CS 6OHDA n=12. Asterisk is p=0.015. (G) Baseline-normalized EPSC amplitudes before and after 5 min of 1 Hz stimulation of TS inputs to dMSNs paired with postsynaptic depolarization to −40 mV in slices from control (left, n=6) and 6OHDA-lesioned (right, n=11) animals. (H) Change in EPSC amplitude and AMPA/NMDA ratio relative to baseline after 1 Hz induction protocol. Control n=6, 6OHDA n=11. Asterisks are p=0.043 (EPSC) and p=0.034 (AMPA/NMDA).
Figure 4
Figure 4. hM4D- and eArch3.0-mediated inhibition of thalamostriatal inputs rescues parkinsonian motor behavior
(A) Bilateral dorsolateral striatal 6ODHA lesions and cannula implants (top) and thalamic hM4D-mCherry expression (bottom) in example control (left) and 6OHDA-lesioned (right) animals. Arrows indicate cannula tracts, dotted line indicates parafascicular nucleus. (B) Example center-point trajectories of control (top) and 6OHDA-lesioned (bottom) mice given saline (grey) or CNO (magenta) by infusion into dorsolateral striatum (intra-DLS, left) or i.p. injection (i.p., right). Each trace represents 30 s of behavior. (C) Average percent of time spent freezing, ambulating, or engaged in fine movement during a 15-minute open field session for control and 6OHDA-lesioned animals infused into the DLS (left) or injected i.p. (right) with saline or CNO. Control: DLS n=8, i.p. n=17; 6OHDA: DLS n=6, i.p. n=16. DLS: asterisk is ambulation p=0.039; i.p. asterisks are p=0.0124 for freezing, p=0.003 for ambulation. (D) Average total velocity for DLS infusions (left) and i.p. injections (right) of saline and CNO in control and 6OHDA-lesioned animals. Asterisks are p=0.028 for DLS and p=0.009 for i.p. (E) Bilateral dorsolateral striatal 6OHDA lesions and optic fiber implants in the DLS (top) of animals expressing eArch3.0 in thalamus (bottom). Arrows indicate fiber tracts, dotted line indicates parafascicular nucleus. (F) Example trajectories of a control and a 6OHDA-lesioned mouse before (grey) or after (green) laser onset. Each trace represents 30 s of behavior. (G) Average percent of time spent freezing, ambulating, or engaged in fine movement across a 15-minute open field session for control and 6OHDA-lesioned animals before, during, and after 560 nm laser stimulation of eArch3.0-expressing thalamostriatal terminals. Control n=9, 6OHDA n=6. Asterisk are ambulation pre vs. laser p=0.022, freezing pre vs. laser p=0.009, ambulation laser vs post p=0.020, freezing laser vs. post p=0.001. (H) Average total velocity before, during, and after eArch3.0-mediated inhibition of thalamostriatal terminals in the DLS of control and 6OHDA-lesioned animals. Asterisks are p=0.008 for pre vs. laser and p=0.007 for laser vs. post.

Comment in

References

    1. Albin RL, Young AB, Penney JB. The functional anatomy of basal ganglia disorders. Trends Neurosci. 1989;12:366–375. doi: 10.1016/0166-2236(89)90074-X. - DOI - PubMed
    1. Caparros-Lefebvre D, Blond S, Feltin MP, Pollak P, Benabid AL. Improvement of levodopa induced dyskinesias by thalamic deep brain stimulation is related to slight variation in electrode placement: possible involvement of the centre median and parafascicularis complex. J Neurol Neurosurg Psychiatry. 1999;67:308–314. doi: 10.1136/jnnp.67.3.308. - DOI - PMC - PubMed
    1. Chen CH, Fremont R, Arteaga-Bracho EE, Khodakhah K. Short latency cerebellar modulation of the basal ganglia. Nat Neurosci. 2014;17:1767–1775. doi: 10.1038/nn.3868. - DOI - PMC - PubMed
    1. Day M, Wang Z, Ding J, An X, Ingham CA, Shering AF, Wokosin D, Ilijic E, Sun Z, Sampson AR, Mugnaini E, Deutch AY, Sesack SR, Arbuthnott GW, Surmeier DJ. Selective elimination of glutamatergic synapses on striatopallidal neurons in Parkinson disease models. Nat Neurosci. 2006;9:251–259. - PubMed
    1. DeLong MR. Primate models of movement disorders of basal ganglia origin. Trends Neurosci. 1990;13:281–285. doi: 10.1016/0166-2236(90)90110-V. - DOI - PubMed

Publication types

MeSH terms

Substances

LinkOut - more resources