. 2016 Feb 2:7:10538.
doi: 10.1038/ncomms10538.

Mito-priming as a method to engineer Bcl-2 addiction

Affiliations

Mito-priming as a method to engineer Bcl-2 addiction

Jonathan Lopez et al. Nat Commun. .

Abstract

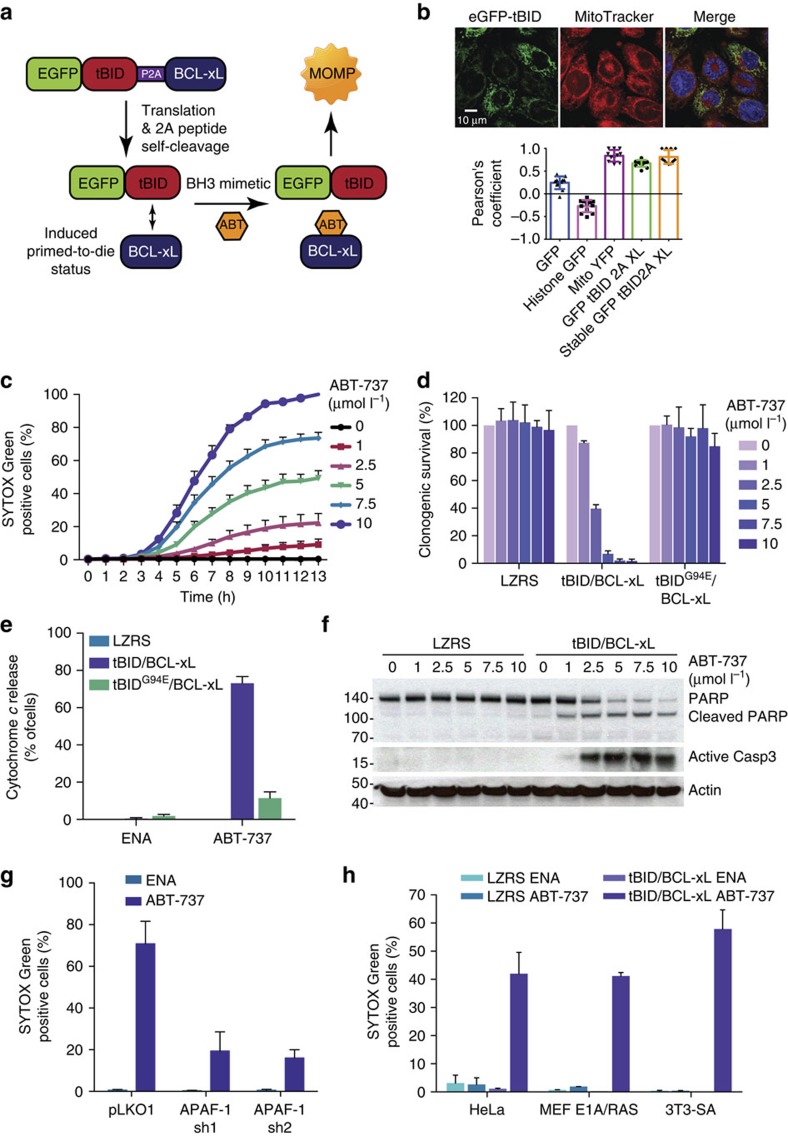
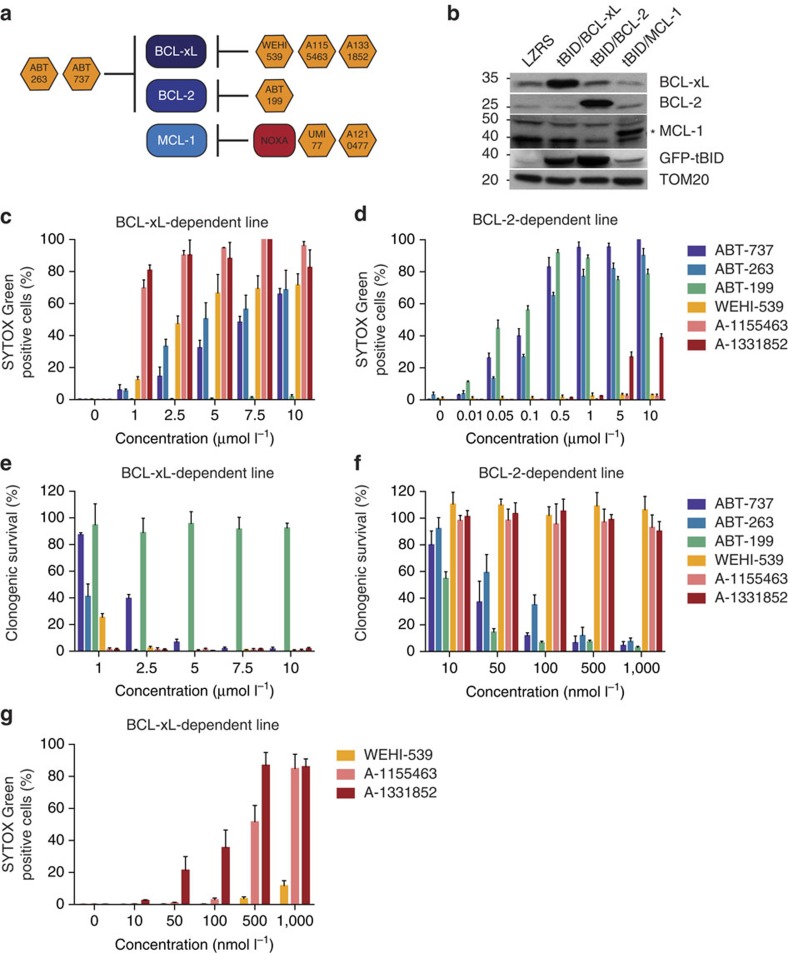
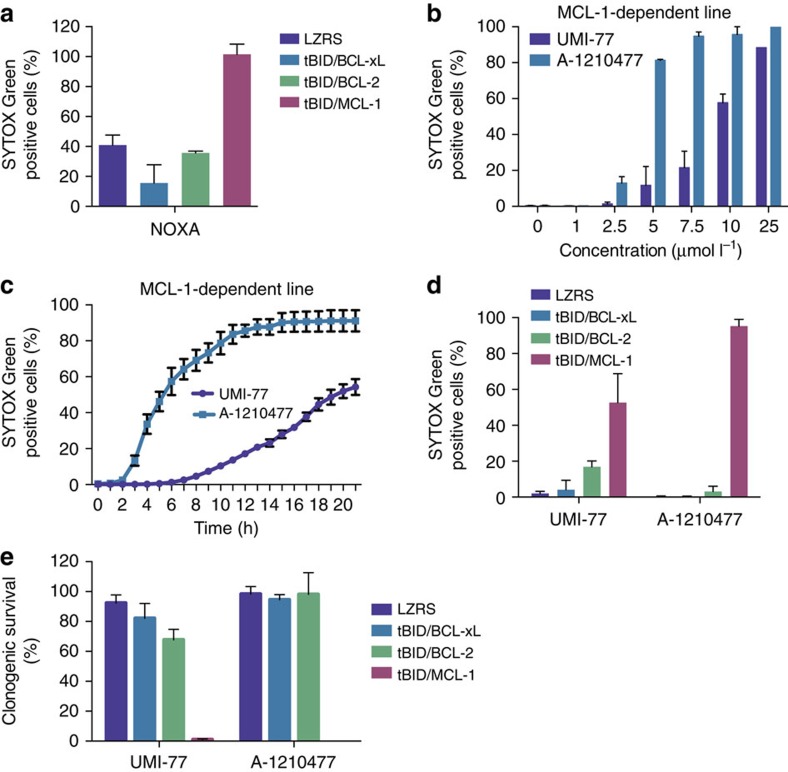
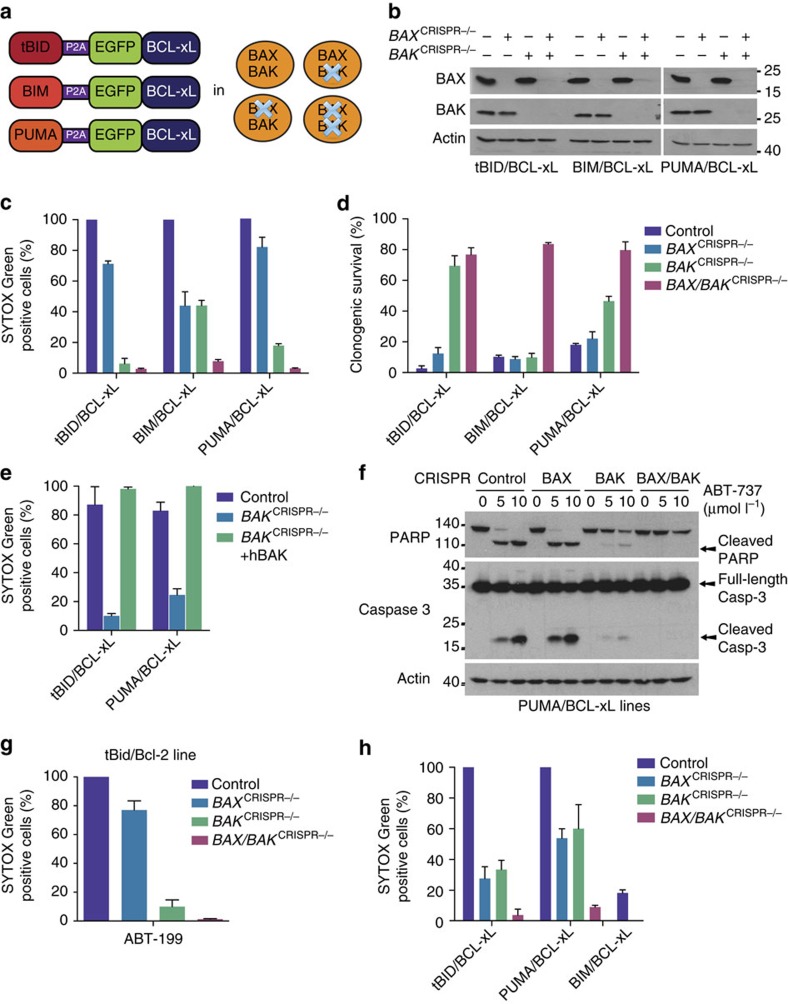
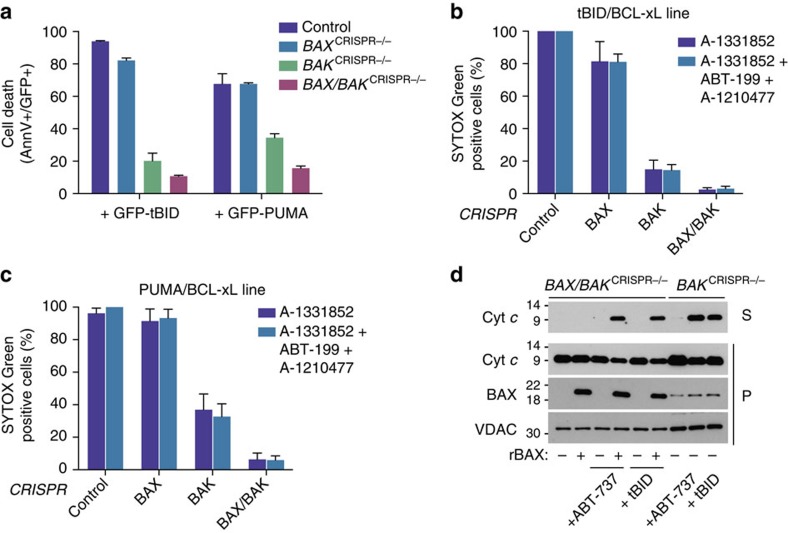
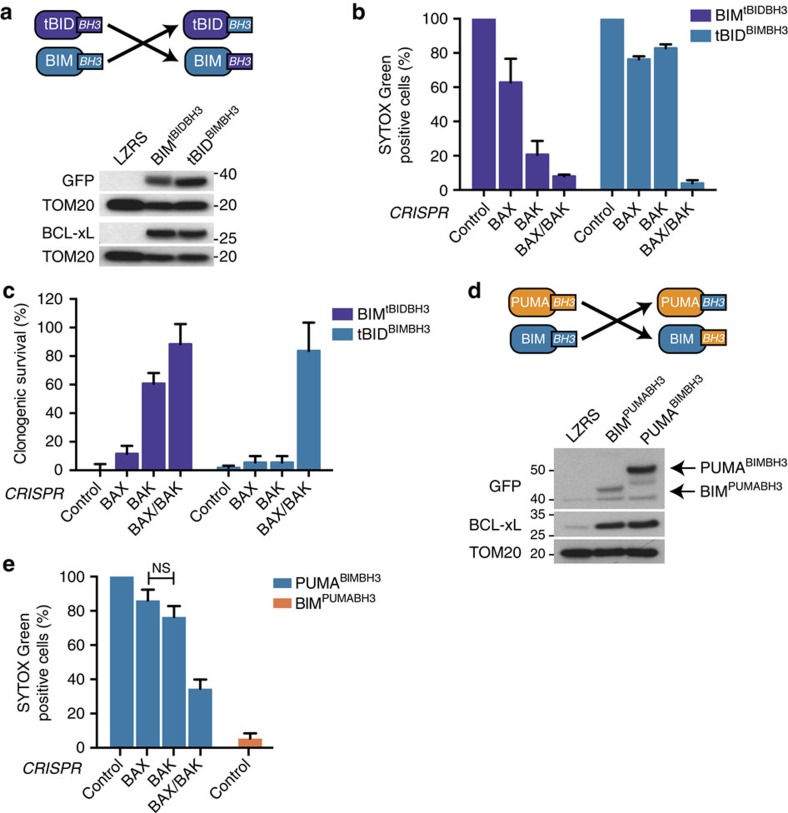
Most apoptotic stimuli require mitochondrial outer membrane permeabilization (MOMP) in order to execute cell death. As such, MOMP is subject to tight control by Bcl-2 family proteins. We have developed a powerful new technique to investigate Bcl-2-mediated regulation of MOMP. This method, called mito-priming, uses co-expression of pro- and anti-apoptotic Bcl-2 proteins to engineer Bcl-2 addiction. On addition of Bcl-2 targeting BH3 mimetics, mito-primed cells undergo apoptosis in a rapid and synchronous manner. Using this method we have comprehensively surveyed the efficacy of BH3 mimetic compounds, identifying potent and specific MCL-1 inhibitors. Furthermore, by combining different pro- and anti-apoptotic Bcl-2 pairings together with CRISPR/Cas9-based genome editing, we find that tBID and PUMA can preferentially kill in a BAK-dependent manner. In summary, mito-priming represents a facile and robust means to trigger mitochondrial apoptosis.


Figures

Figure 1
Figure 1. Mito-priming as a method of induced Bcl-2 addiction.
(a) Method outline. (b) SVEC cells expressing eGFP-tBID 2A BCL-xL or other constructs were co-stained with MitoTracker Deep Red. Colocalization was quantified using the Pearson's coefficient. Representative images show eGFP-tBID expression and MitoTracker Deep Red staining from SVEC cells stably expressing eGFP-tBID 2A BCL-xL. Scale bar, 10 μm. (c) SVEC cells expressing eGFP-tBID 2A BCL-xL were treated with ABT-737 and analysed for cell viability using an IncuCyte imager and SYTOX Green exclusion. Percentage cell death was calculated by normalizing against maximal cell death (13-h treatment with 10 μmol l−1 ABT-737). Error bars represent the standard error of the mean (s.e.m.) from three independent experiments. (d) SVEC cells stably expressing the indicated constructs were treated with increasing concentrations of ABT-737 (μmol l−1; 24 h) and assayed for clonogenic survival. Error bars represent the s.d. of triplicate samples from a representative experiment carried out twice independently. (e) SVEC cells stably expressing indicated constructs were treated with increasing concentration of ABT-737 (μmol l−1) for 6 h with 10 μmol l−1 ABT-737 in presence of Q-VD-OPh. Cells were quantified for cytochrome c release by confocal microscopy. Error bars represent the s.e.m. of three independent experiments. (f) SVEC cells stably expressing the indicated constructs were treated for 6 h with ABT-737 (μmol l−1). PARP and caspase-3 cleavage was determined by western blot. Actin was probed as a loading control. (g) SVEC cells stably expressing the indicated constructs were treated for 13 h with 10 μmol l−1 ABT-737 or enantiomer (ENA). Cell viability was determined as in c. Percentage cell death was calculated by normalizing against 100% cell death (24-h treatment with 1 μmol l−1 actinomycin D). (h) Cell lines stably expressing control vector (pLKO1) or two independent shRNA sequences targeting APAF-1 were treated for 16 h with enantiomer (ENA) or ABT-737. 100% death: 24-h treatment with 1 μmol l−1 actinomycin D (for each line). Cell viability was determined as in c. Percentage cell death was calculated by normalizing against 100% cell death (24-h treatment with 1 μmol l−1 actinomycin D). In g,h error bars represent the s.e.m. of three independent experiments. See also Supplementary Fig. 1 and Supplementary Movies 1–3. Q-VD-OPh, quinolyl-valyl-O-methylaspartyl-(2,6-difluoro- phenoxy)-methyl ketone.
Figure 2
Figure 2. Applying mito-priming to define the selectivity and potency of BH3 mimetics.
(a) Predicted pattern of inhibition by different BH3 mimetics tested. (b) Western blot analysis of SVEC cells stably expressing eGFP-tBID 2A BCL-xL, eGFP-tBID 2A BCL-2 or eGFP-tBID 2A MCL-1. * denotes ectopically expressed MCL-1. (c,d) SVEC cells stably expressing eGFP-tBID 2A BCL-xL (BCL-xL-dependent line) or eGFP-tBID 2A BCL-2 (BCL2-dependent line) were treated with increasing concentrations of different BH3 mimetics. Cell viability was determined by SYTOX Green dye exclusion and live-cell imaging using an IncuCyte imager. Error bars represent the s.e.m. of three independent experiments. (e,f) BCL-xL (e) or BCL-2-dependent lines (f) were treated with increasing concentrations of different BH3 mimetics and analysed for long-term survival by clonogenic assay. Percentage clonogenic survival is plotted relative to untreated cells. Error bars represent the s.d. of triplicate samples from a representative experiment carried out twice independently. (g) BCL-xL-dependent line was treated with increasing concentrations of BCL-xL-directed BH3 mimetics. Cell viability was determined by SYTOX Green dye exclusion and live-cell imaging using an IncuCyte imager. Errors bars represent the s.e.m. of three independent experiments. See also Supplementary Fig. 2.
Figure 3
Figure 3. Mito-priming defines potent and specific MCL-1 targeting BH3 mimetics.
(a) SVEC cells stably expressing FLAG-tBID 2A GFP-BCL-xL, FLAG-tBID 2A GFP-BCL-2 or FLAG-tBID 2A GFP-MCL-1 were transiently transfected with NOXA. Cell viability was analysed 24 h post-transfection by SYTOX Green dye exclusion and live-cell imaging using an IncuCyte imager. Error bars represent the s.e.m. of three independent experiments. (b) SVEC cells stably expressing FLAG-tBID 2A GFP-MCL-1 (MCL-1-dependent line) were treated with increasing concentrations of putative MCL-1 inhibitors UMI-77 or A-1210477. Cell viability was analysed 24 h post-treatment by SYTOX Green dye exclusion and live-cell imaging using an IncuCyte imager. Error bars represent the s.e.m. of three independent experiments. (c) MCL-1-dependent line was treated with UMI-77 or A-1210477 (both 10 μmol l−1) and analysed over time for cell viability by SYTOX Green dye exclusion and live-cell imaging using an IncuCyte imager. Error bars represent the s.e.m. of three independent experiments. (d,e) SVEC cells stably expressing FLAG-tBID 2A GFP-BCL-xL, FLAG-tBID 2A GFP-BCL-2 or FLAG-tBID 2A GFP-MCL-1 were treated with UMI-77 or A-1210477 (10 μM for 24 h) then cell viability was analysed by SYTOX Green dye exclusion and live-cell imaging using an IncuCyte imager (d) or by clonogenic survival assay (e). Error bars represent the s.e.m. of three independent experiments for d and s.d. of triplicate samples from a representative experiment carried out twice independently for e. In all cases, cells were treated with MCL-1 inhibitors in 3% FBS containing DMEM.
Figure 4
Figure 4. Mito-priming reveals a dependence of tBID and PUMA for BAK over BAX.
(a) Overview of cell lines generated. (b) Western blot analysis of BAX and BAK expression in CRISPR/CAS9 genome edited cell lines. Actin was probed as a loading control. (c,d) SVEC cells stably expressing tBID-, BIM- or PUMA 2A GFP-BCL-xL were treated with ABT-737 (10 μmol l−1) then cell viability was analysed by SYTOX Green dye exclusion and live-cell imaging using an IncuCyte imager (c) or by clonogenic survival assay (d). In c cell death was normalized to treated, empty CRISPR control for each line (Control, each 100% cell death). Error bars represent the s.e.m. of 3 independent experiments (c) or s.d. of triplicate samples from a representative experiment carried out twice independently (d). (e) BAK-deleted or reconstituted SVEC cells stably expressing FLAG-tBID 2A BCL-xL or FLAG-PUMA 2A BCL-xL were treated with ABT-737 (10 μmol l−1 for 16 h). Cell viability was analysed by SYTOX Green dye exclusion and IncuCyte imaging. Percentage cell death was calculated following normalization to treated control for each line (each 100% cell death). Errors bars represent the s.e.m. of three independent experiments. (f) SVEC cells stably expressing FLAG-PUMA 2A BCL-xL were treated for 4 h with increasing concentrations of ABT-737. Cleavage of caspase-3 and PARP was assessed by western blot. Actin was probed as a loading control. (g) Genome-edited SVEC cells stably expressing eGFP-tBID 2A BCL-2 were treated with ABT-199 (10 μmol l−1) and analysed for cell viability using SYTOX Green exclusion and IncuCyte imaging. Percentage cell death was calculated following normalization to ABT-199 treated empty CRISPR vector control line for 16 h. Errors bars represent the s.e.m. of three independent experiments. (h) Genome-edited HeLa cells stably expressing either eGFP-tBID, BIM or PUMA 2A BCL-xL were treated with 10 μmol l−1 ABT-737 for 24 h and analysed for cell viability by SYTOX Green exclusion and IncuCyte imaging. 100% death was set-up as the maximal ABT-737-induced death in the empty control line. Errors bars represent the s.e.m. of three independent experiments. See also Supplementary Fig. 3.
Figure 5
Figure 5. Selective dependence of tBID and PUMA for BAK is independent of prosurvival Bcl-2 function and requires a cellular environment.
(a) SVEC cell lines were transiently transfected with GFP–tBID or GFP–PUMA. Sixteen hours post transfection the percentage of Annexin V-positive cells in the GFP-expressing population (AnnV+/GFP+) was quantified by flow-cytometry. Error bars represent the s.d. of triplicate samples from a representative experiment carried out twice independently. (b) Control, BAX and/or BAKCRISPR−/− cells stably expressing eGFP-tBID 2A BCL-xL were treated with for 1 h with 10 μmol l−1 ABT-199 and A-1210477 before the addition of A-1331852 (10 μmol l−1). Cell viability was analysed by SYTOX Green dye exclusion and live-cell imaging using an IncuCyte imager. Percentage cell death was calculated following normalization to treated control for each line (each 100% cell death). Error bars represent the s.e.m. from three independent experiments. (c) Control, BAX and/or BAKCRISPR−/− SVEC cells stably expressing eGFP-PUMA 2A BCL-xL were treated as in b. Errors bars represent the s.e.m. from three independent experiments. (d) Isolated mitochondria from BAX and/or BAKCRISPR−/− SVEC cells stably expressing eGFP-tBid 2A BCL-xL were treated in the presence or absence of 100 nM recombinant wild-type Bax and/or 10 μM ABT-737 or 10 nM recombinant tBID. Mitochondrial permeabilization was monitored by western blot analysis of cytochrome c into the supernatant (S). The mitochondrial fraction (P), Bax and VDAC serve as loading controls.
Figure 6
Figure 6. BH3-only protein dependency for BAK is dictated by the BH3-domain.
(a) SVEC cells stably expressing GFP-BIMtBID BH3 or GFP-tBIDBIM BH3 together with BCL-xL were analysed by Western blot for construct expression. (b,c) Cell death and long-term clonogenic survival of GFP-BIMtBID BH3 and GFP-tBIDBIM BH3 2A BCL-xL CRISPR lines treated with 10 μmol l−1 ABT-737. (b) Error bars represent the s.e.m. of three independent experiments. Percentage cell death was calculated by normalizing to ABT-737-induced death in the empty CRISPR control line (100% death). (c) Error bars represent the s.d. of triplicate samples from a representative experiment carried out twice independently. (d) SVEC cells stably expressing GFP–BIMPUMA BH3 or GFP–PUMABIM BH3 together with BCL-xL were analysed by western blot for construct expression. (e) Cell death of GFP–BIMPUMA BH3 and GFP–PUMABIM BH3 2A BCL-xL CRISPR lines treated with 10 μmol l−1 ABT-737. Error bars represent the s.e.m. of three independent experiments. Percentage cell death was calculated by normalizing to ABT-737-induced death in the empty CRISPR control line (100% death). See also Supplementary Fig. 4.

References

    1. Tait S. W. & Green D. R. Mitochondria and cell death: outer membrane permeabilization and beyond. Nat. Rev. Mol. Cell Biol. 11, 621–632 (2010). - PubMed
    1. Tait S. W., Ichim G. & Green D. R. Die another way--non-apoptotic mechanisms of cell death. J. Cell. Sci. 127, 2135–2144 (2014). - PMC - PubMed
    1. Czabotar P. E., Lessene G., Strasser A. & Adams J. M. Control of apoptosis by the BCL-2 protein family: implications for physiology and therapy. Nat. Rev. Mol. Cell Biol. 15, 49–63 (2014). - PubMed
    1. Hanahan D. & Weinberg R. A. The hallmarks of cancer. Cell 100, 57–70 (2000). - PubMed
    1. Certo M. et al. Mitochondria primed by death signals determine cellular addiction to antiapoptotic BCL-2 family members. Cancer cell 9, 351–365 (2006). - PubMed

Publication types