. 2016 Jan 29:13:2.
doi: 10.1186/s12987-016-0027-0.

Modeling immune functions of the mouse blood-cerebrospinal fluid barrier in vitro: primary rather than immortalized mouse choroid plexus epithelial cells are suited to study immune cell migration across this brain barrier

Affiliations

Modeling immune functions of the mouse blood-cerebrospinal fluid barrier in vitro: primary rather than immortalized mouse choroid plexus epithelial cells are suited to study immune cell migration across this brain barrier

Ivana Lazarevic et al. Fluids Barriers CNS. .

Abstract

Background: The blood-cerebrospinal fluid barrier (BCSFB) established by the choroid plexus (CP) epithelium has been recognized as a potential entry site of immune cells into the central nervous system during immunosurveillance and neuroinflammation. The location of the choroid plexus impedes in vivo analysis of immune cell trafficking across the BCSFB. Thus, research on cellular and molecular mechanisms of immune cell migration across the BCSFB is largely limited to in vitro models. In addition to forming contact-inhibited epithelial monolayers that express adhesion molecules, the optimal in vitro model must establish a tight permeability barrier as this influences immune cell diapedesis.

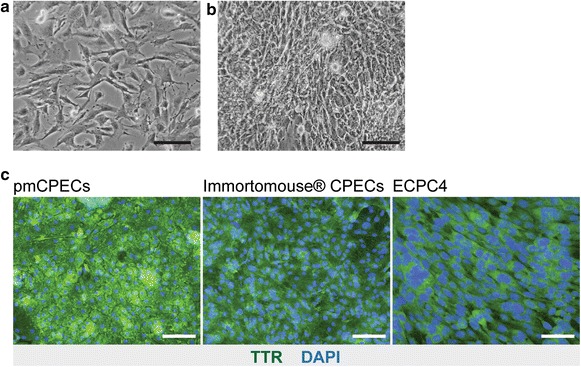
Methods: We compared cell line models of the mouse BCSFB derived from the Immortomouse(®) and the ECPC4 line to primary mouse choroid plexus epithelial cell (pmCPEC) cultures for their ability to establish differentiated and tight in vitro models of the BCSFB.

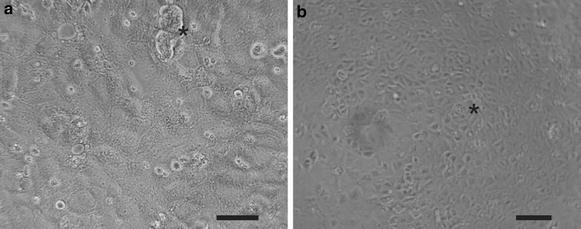
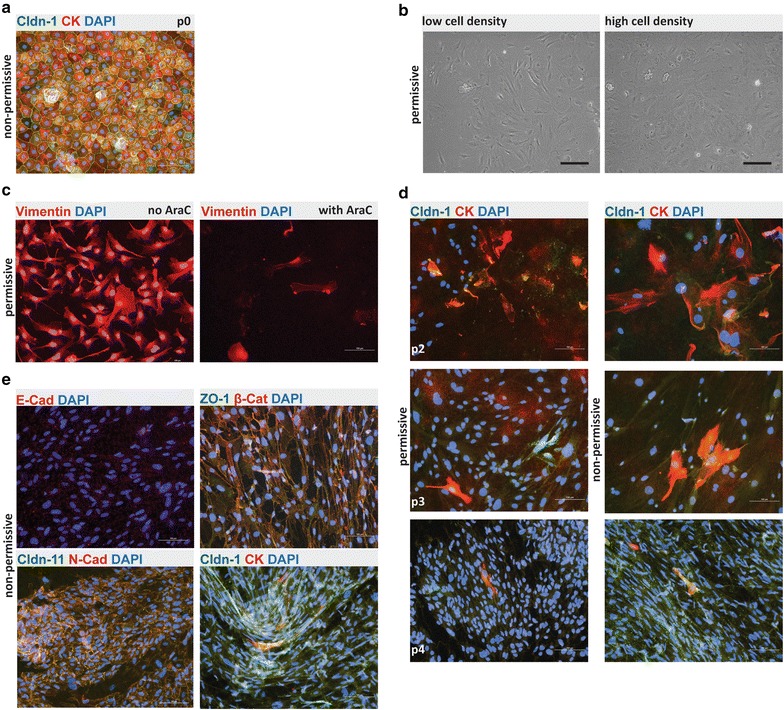
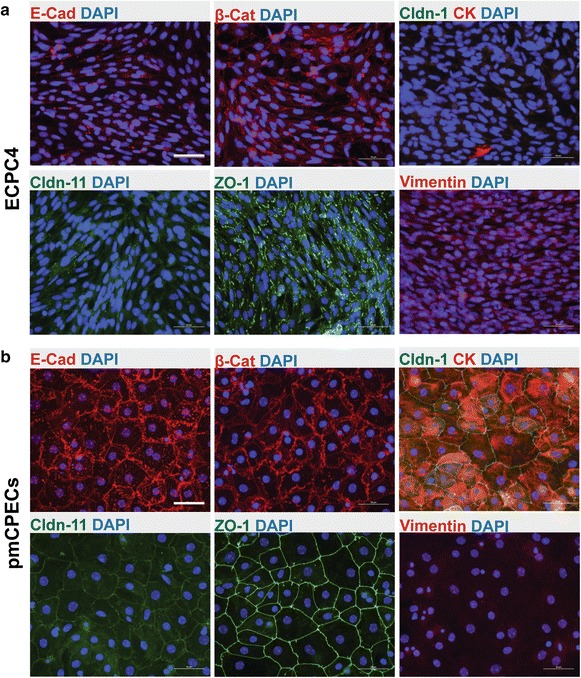
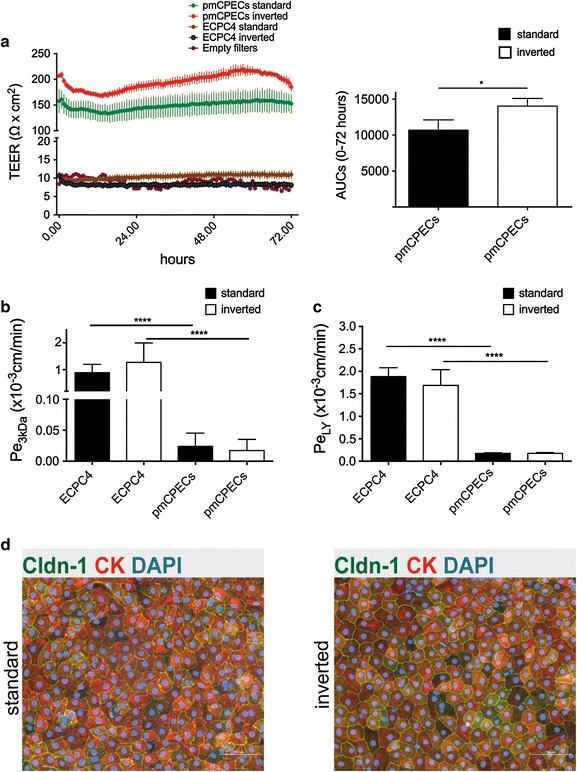
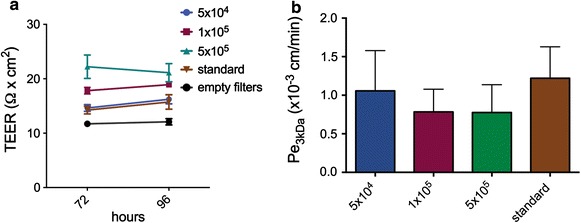
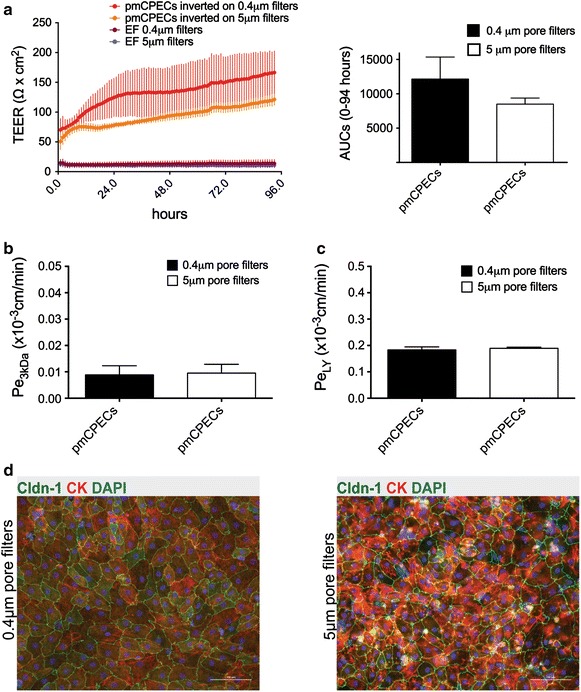
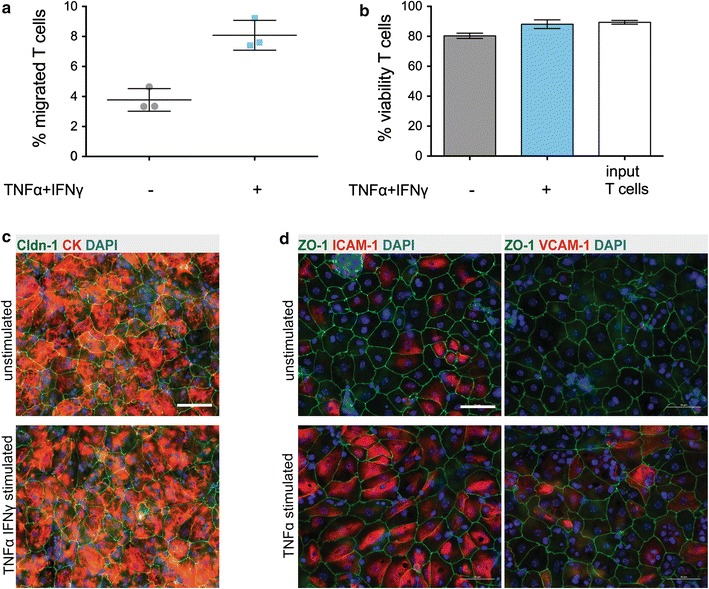
Results: We found that inducible cell line models established from the Immortomouse(®) or the ECPC4 tumor cell line did not express characteristic epithelial proteins such as cytokeratin and E-cadherin and failed to reproducibly establish contact-inhibited epithelial monolayers that formed a tight permeability barrier. In contrast, cultures of highly-purified pmCPECs expressed cytokeratin and displayed mature BCSFB characteristic junctional complexes as visualized by the junctional localization of E-cadherin, β-catenin and claudins-1, -2, -3 and -11. pmCPECs formed a tight barrier with low permeability and high electrical resistance. When grown in inverted filter cultures, pmCPECs were suitable to study T cell migration from the basolateral to the apical side of the BCSFB, thus correctly modelling in vivo migration of immune cells from the blood to the CSF.

Conclusions: Our study excludes inducible and tumor cell line mouse models as suitable to study immune functions of the BCSFB in vitro. Rather, we introduce here an in vitro inverted filter model of the primary mouse BCSFB suited to study the cellular and molecular mechanisms mediating immune cell migration across the BCSFB during immunosurveillance and neuroinflammation.


Figures

Fig. 1
Fig. 1
Morphology of confluent primary mouse choroid plexus epithelial cells (pmCPECs). Representative phase contrast pictures of cells plated directly after choroid plexus dissection and cell disaggregation and cultured in complete growth medium for 8 days. The pmCPECs exhibit a predominant polygonal morphology with rare unprocessed tissue remnants (asterisk) visible in a and occasional dome like cell aggregates (asterisk) visible in b. The contrast of picture a was enhanced using Adobe Photoshop software. Scale bar in a = 50 μm and in b = 100 μm
Fig. 2
Fig. 2
Phenotype and irreversible de-differentiation of Immortomouse® CPECs. a Primary Immortomouse® choroid plexus epithelial cells (p0) grown at 37 °C for 7 days showed the same staining patterns for cytokeratin (CK) and claudin-1 (Cldn-1) as pmCPECs isolated from wild-type mice. b When Immortomouse® CPECs were grown under permissive conditions (33 °C, 10U IFNγ) the heterogenous de-differentiation process started in areas with low cell density, whereas CPECs kept their cuboidal shape longer in areas with high cell density. The contrast of the pictures in a and b was enhanced using Adobe Photoshop software. c Vimentin staining, rather than CK staining was observed at 33 °C. Cell death took place at 33 °C upon Ara-C addition to culture. d The irreversible loss of CPEC specific markers Cldn-1 and CK and an increasing proliferation rate of de-differentiated Immortomouse® CPECs was observed with increased passage. The first row is passage 2 (p2), the second row is p3, the third row is p4. e The cells failed to form confluent monolayers or display the correct expression pattern of epithelial markers upon shift to non-permissive temperature and IFNγ withdrawal. Immortomouse® CPECs in e were stained after 7 days of non-permissive growth; the passage numbers (p) were E-cad/DAPI: p8, ZO1/β-Cat/DAPI: p5, Cldn11/N-Cad/DAPI: p6, Cldn-1/CK/DAPI: p4. Scale bar in all immunofluorescent and phase contrast pictures = 100 μm. p0 primary culture, E-Cad E-cadherin, N-Cad N-cadherin, Cldn-1 Claudin 1, Cldn-11 Claudin 11, CK cytokeratin, β-Cat β-Catenin, ZO1 zona occludens protein 1
Fig. 3
Fig. 3
Morphology, expression of transthyretin and propagation of ECPC4 cells. Representative phase contrast pictures of ECPC4 cells from passage 41 on d1 (a) and d4 (b) after sub-cultured in a 1:4 ratio as described by the distributer. The cells did not show typical epithelial morphology (a, b) and grew in overlapping layers (b). Scale bars 50 μm. c Immunofluorescence staining for the CPEC-specific marker transthyretin (TTR) is shown in pmCPECs, Immortomouse® CPECs from passage 6, grown for 7 days at non-permissive conditions and for the ECPC4 cells. Scale bars a, b and ECPC4 cells = 50 μm; pmCPECs and Immortomouse® CPECs = 100 μm
Fig. 4
Fig. 4
Phenotype of ECPC4 cells and primary mouse choroid plexus epithelial cells (pmCPECs). Immunofluorescence staining for CPEC specific proteins is shown in ECPC4 cells (a) and pmCPECs (b). a There is weak staining for the adhesion junction (AJ) protein E-Cadherin (E-Cad) and its cytoskeleton linker β-catenin (β-Cat) of ECPC4 cells and their localization is not specifically at the plasma membrane. Staining for tight junctional (TJ) claudins-1 and -11 was absent or showed a weak cytosolic pattern, respectively. The scaffolding protein ZO1 staining was disrupted. Additionally, the cell line failed to stain for the early epithelial marker cytokeratin but rather was positive for the mesenchymal intermediate filament protein vimentin. ECPC4 cells from passage 41 were stained on d4 in culture. b In contrast, the staining of pmCPECs stained on d7 in culture, revealed a proper distribution of all epithelial markers. pmCPECs. All staining was performed at least 3 times. Scale bars 50 μm. E-Cad E-cadherin, Cldn-1 Claudin 1, Cldn-11 claudin 11, CK cytokeratin, β-Cat β-catenin, ZO-1 zona occludens protein 1
Fig. 5
Fig. 5
Comparison of barrier characteristics of ECPC4 versus pmCPECs. a The time-dependent progression of the transepithelial electrical resistance (TEER) of ECPC4 cells and pmCPECs grown on standard (luminal) or inverted (abluminal) Transwell filter inserts was measured by impedance spectroscopy using the cellZscope device. The TEER of ECPE4 hardly differs from the TEER measured across laminin coated empty filters (EF). In contrast, pmCPECs reach a TEER of 150–200 Ω cm2 on d7. The figure shows one representative experiment (of 4) of pmCPECs in comparison to ECPC4 over their last 72 h in culture with 3 filters per condition and 1 empty filter. The colored lines show the mean TEER values of triplicate measurements surrounded by colored areas, which represent the SD. The area under the curve (AUC) as a measure for the overall TEER across the cellular barriers over time (Unit: Ω cm2 h) was assessed for a comparison of the overall resistance of the cell layers. *p < 0.05. b, c The permeability for Alexa Fluor 680-3 kDa dextran (Pe3kDa) (b) was measured in 5 independent experiments with at least three filters per condition (ECPC4 standard: n = 3, ECPC4 inverted: n = 3, pmCPECs standard: n = 5, pmCPECs inverted n = 4) and the permeability for 457 Da Lucifer Yellow (PeLY) was measured once with at least 3 filters per condition (ECPC4 standard: n = 3, ECPC inverted: n = 3, pmCPECs standard: n = 5, pmCPECs inverted: n = 4) ****p < 0.0001 (c). d Immunofluorescence staining for claudin-1 (Cldn-1), cytokeratin (CK) and nuclei (DAPI) showed no differences between monolayers grown on the upper (standard) or lower (inverted) side of the filter. Scale bar 100 μm. Bars in b, c represent the mean permeability coefficients Pe ± SD
Fig. 6
Fig. 6
Barrier properties of titrated ECPC4 cells growing on Transwell filter inserts. a Different numbers of ECPC4 cells (5 × 104, 1 × 105, 5 × 105 and standard) were plated on the inverted porous filter membranes in triplicate. Standard = ECPC4 continuously split in a ratio 1:4, according to the distributer’s protocol (number of cells not counted). TEER was measured manually once per day on d3 and d4 in culture using the EndOhm device. The cells failed to build up a resistance irrespective of their seeding density. b The permeability coefficient (Pe) for Alexa Fluor 680–3 kDa dextran was assessed after the resistance measurement on d4. Bars represent the mean ± SD of all filters from two independent experiments, n = 6 for all groups
Fig. 7
Fig. 7
Comparison of barrier characteristics of inverted cultures of pmCPECs on filters with 0.4 and 5 μm pores. a The time dependent progression of the transepithelial electrical resistance (TEER) of pmCPECs grown or inverted (abluminal) Transwell filter inserts with 0.4 and 5 μm pores was measured by impedance spectroscopy using the cellZscope device from d3 to d7 in culture. The pmCPECs on both kinds of filters reached a TEER of 100–150 Ω cm2 on d7. The figure shows one experiment with 3 filters per condition and 3 empty filters per condition. The colored lines show the mean TEER values of triplicate measurements surrounded by colored areas, which represent the SD. The area under the curve (AUC; Units: Ω cm2 h) was assessed for a comparison of the overall resistance of the cell layers over time with no significant difference detected. b, c The permeability of the pmCPEC grown on inverted Transwell filter inserts with 0.4 and 5 μm pores for two different small molecular tracers was determined following the TEER measurements in 1 experiment with n = 4 filters per condition. There was no difference for the permeability of Alexa Fluor 680–3 kDa dextran (Pe3kDa) (b) or for 457 Da Lucifer Yellow (PeLY) (c) across the pmCPECs cultured on either type of filter. d Immunofluorescence staining for claudin-1 (Cldn-1), cytokeratin (CK) and nuclei (DAPI) on pmCPEC monolayers grown on the inverted sides of filter inserts with 0.4 and 5 μm pores. The difference in clarity between the pictures is due to different microscopic characteristics of the filters. Scale bar 100 μm. Bars represent the mean permeability coefficients Pe ± SD
Fig. 8
Fig. 8
Migration of encephalitogenic CD4+ Th1 cells across the BCSFB in vitro. a Transmigration rates of encephalitogenic CD4+ Th1 effector/memory T cells across non-stimulated and cytokine-stimulated CPECs during a period of 8 h were assessed in vitro. Percentage of total transmigrated encephalitogenic T cells across the unstimulated (−) and TNFα/IFNγ co-stimulated (+) pmCPEC layer in relation to the input sample referred as 100 %. Data represent mean ± SD of one experiment with three filters per condition. b Viability of T cells in the lower compartment of the Transwell filter system was confirmed after the incubation time of 8 h. The error bars represent mean ± SD. c Immunofluorescence staining for the TJ protein Claudin 1 (Cldn-1) and for cytokeratin (CK) confirming the intact cellular monolayer integrity after the transmigration assay. d Immunostaining of pmCPECs showing upregulation of adhesion molecules ICAM-1 and VCAM-1 upon stimulation with the pro-inflammatory cytokine TNFα. Scale bars in c and d = 50 μm

Similar articles

Cited by

References

    1. Strazielle N, Ghersi-Egea JF. Choroid plexus in the central nervous system: biology and physiopathology. J Neuropathol Exp Neurol. 2000;59:561–574. doi: 10.1093/jnen/59.7.561. - DOI - PubMed
    1. Wolburg H, Paulus W. Choroid plexus: biology and pathology. Acta Neuropathol. 2010;119:75–88. doi: 10.1007/s00401-009-0627-8. - DOI - PubMed
    1. Engelhardt B, Wolburg-Buchholz K, Wolburg H. Involvement of the choroid plexus in central nervous system inflammation. Microsc Res Tech. 2001;52:112–129. doi: 10.1002/1097-0029(20010101)52:1<112::AID-JEMT13>3.0.CO;2-5. - DOI - PubMed
    1. Tietz S, Engelhardt B. Brain barriers: crosstalk between complex tight junctions and adherens junctions. J Cell Biol. 2015;209:493–506. doi: 10.1083/jcb.201412147. - DOI - PMC - PubMed
    1. Vorbrodt AW, Dobrogowska DH. Molecular anatomy of intercellular junctions in brain endothelial and epithelial barriers: electron microscopist’s view. Brain Res Brain Res Rev. 2003;42:221–242. doi: 10.1016/S0165-0173(03)00177-2. - DOI - PubMed

Publication types