. 2016 Feb 1;198(7):1149-59.
doi: 10.1128/JB.00896-15.

Short-Stalked Prosthecomicrobium hirschii Cells Have a Caulobacter-Like Cell Cycle

Affiliations

Short-Stalked Prosthecomicrobium hirschii Cells Have a Caulobacter-Like Cell Cycle

Michelle Williams et al. J Bacteriol. .

Abstract

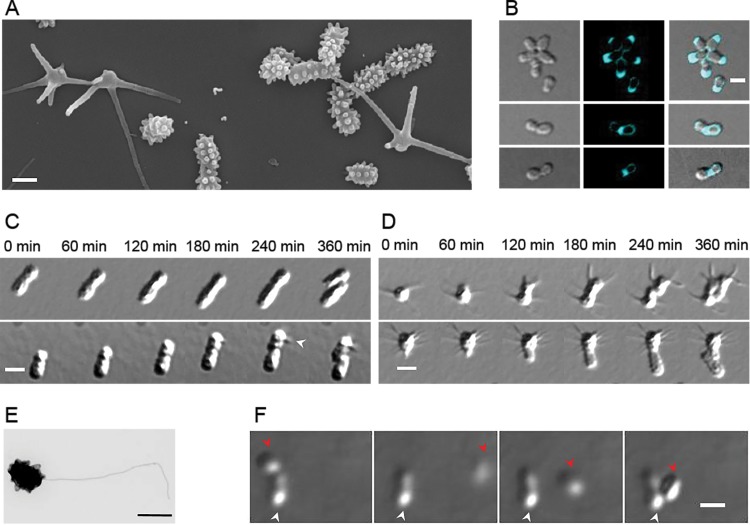
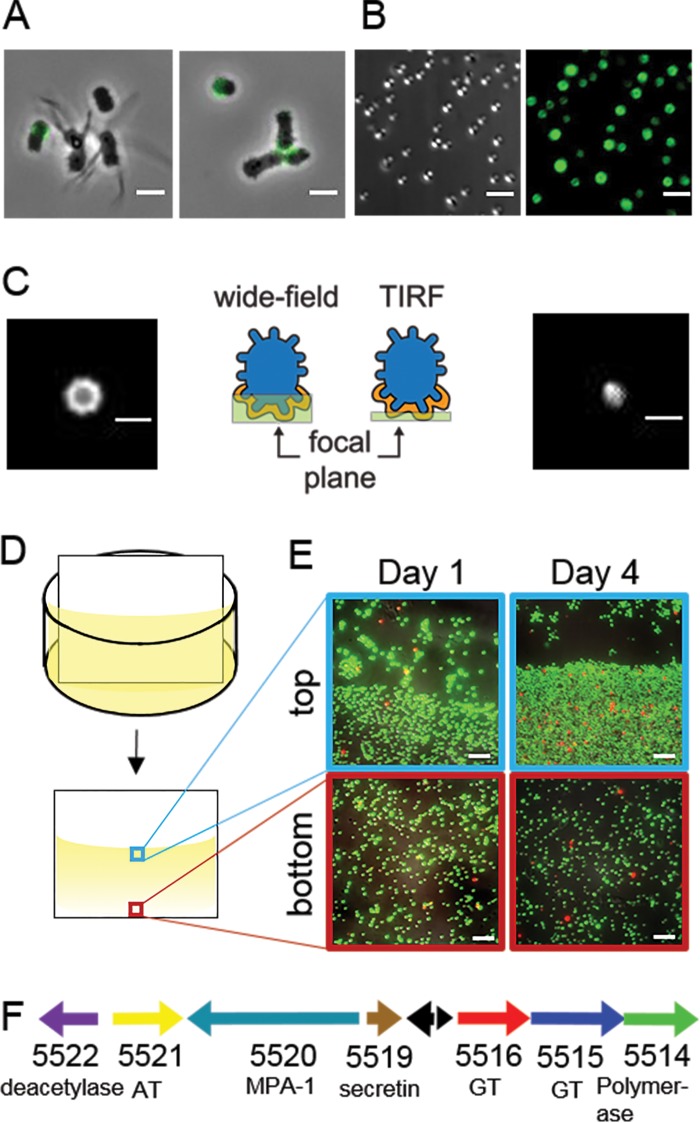
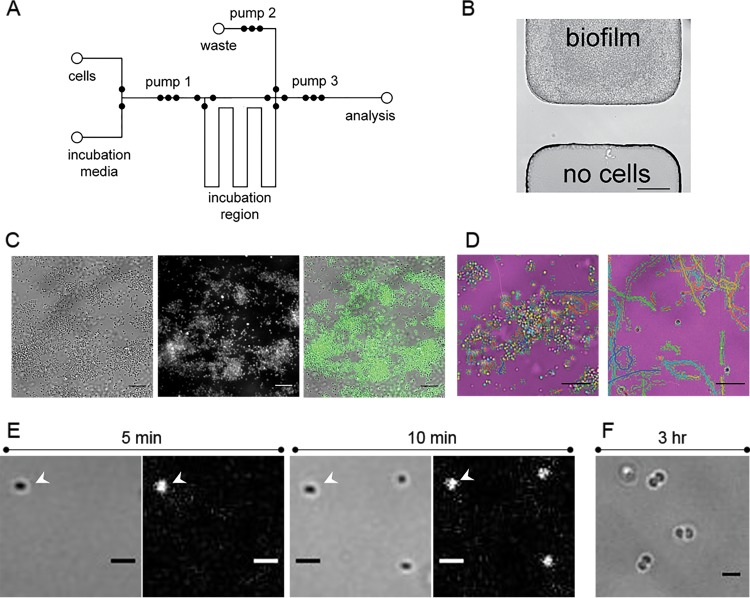
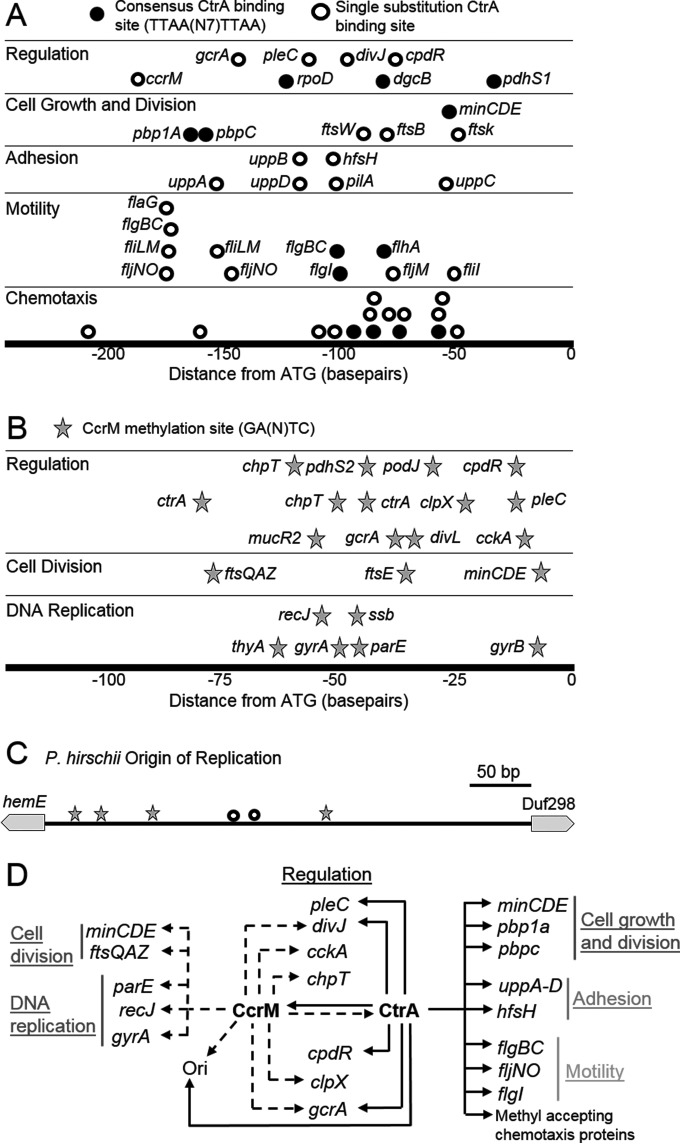
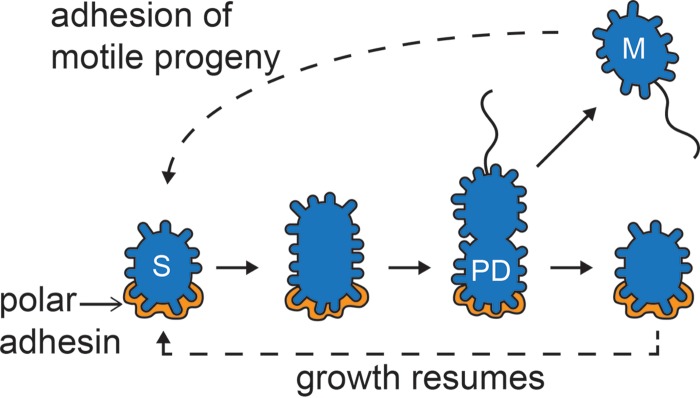
The dimorphic alphaproteobacterium Prosthecomicrobium hirschii has both short-stalked and long-stalked morphotypes. Notably, these morphologies do not arise from transitions in a cell cycle. Instead, the maternal cell morphology is typically reproduced in daughter cells, which results in microcolonies of a single cell type. In this work, we further characterized the short-stalked cells and found that these cells have a Caulobacter-like life cycle in which cell division leads to the generation of two morphologically distinct daughter cells. Using a microfluidic device and total internal reflection fluorescence (TIRF) microscopy, we observed that motile short-stalked cells attach to a surface by means of a polar adhesin. Cells attached at their poles elongate and ultimately release motile daughter cells. Robust biofilm growth occurs in the microfluidic device, enabling the collection of synchronous motile cells and downstream analysis of cell growth and attachment. Analysis of a draft P. hirschii genome sequence indicates the presence of CtrA-dependent cell cycle regulation. This characterization of P. hirschii will enable future studies on the mechanisms underlying complex morphologies and polymorphic cell cycles.

Importance: Bacterial cell shape plays a critical role in regulating important behaviors, such as attachment to surfaces, motility, predation, and cellular differentiation; however, most studies on these behaviors focus on bacteria with relatively simple morphologies, such as rods and spheres. Notably, complex morphologies abound throughout the bacteria, with striking examples, such as P. hirschii, found within the stalked Alphaproteobacteria. P. hirschii is an outstanding candidate for studies of complex morphology generation and polymorphic cell cycles. Here, the cell cycle and genome of P. hirschii are characterized. This work sets the stage for future studies of the impact of complex cell shapes on bacterial behaviors.


Figures

FIG 1
FIG 1
P. hirschii has two distinct morphotypes. (A) Scanning electron microscope image of P. hirschii cells highlights the short- and long-stalked morphologies. The image was acquired at 60,000× magnification. Scale bar = 1 μm. (B) Fluorescent d-amino acid staining of cells reveals polar and midcell peptidoglycan synthesis. Scale bar = 2 μm. (C) Time-lapse differential interference contrast (DIC) images taken every 60 min on MMB agar pads show a short-stalked mother cell giving rise to a short-stalked daughter cell (top) and a short-stalked mother cell giving rise to a long-stalked daughter cell (bottom). The white arrowhead indicates the formation of a long stalk. Scale bar = 2 μm. (D) A long-stalked mother cell gives rise to a long-stalked daughter cell (top), and a long-stalked mother cell gives rise to a short-stalked daughter cell (bottom). Scale bar = 2 μm. (E) Transmission electron micrograph of an individual short-stalked P. hirschii cell with a single polar flagellum. Scale bar = 1 μm. (F) Montage showing a nonmotile mother cell producing a motile daughter cell. The white arrowheads indicate the stationary mother cell. The red arrowheads indicate the position of the motile daughter cell in the each image. The images shown were acquired at 20-min intervals. Scale bar = 2 μm.
FIG 2
FIG 2
Short-stalked P. hirschii cells produce a holdfast. (A) A polar polysaccharide is detected by labeling with WGA-AF488 (green) in short-stalked cells but is absent in long-stalked cells. Scale bar = 2 μm. (B) Short-stalked cells with a holdfast attach polarly to a glass surface. A DIC image (left) and fluorescence image of WGA-AF488 signal (right) of attached cells are shown. Scale bar = 2 μm. (C) Wide-field (left) and TIRF (right) images of a holdfast reveal that the holdfast is located at the surface-cell interface and forms a cap around the cell pole. Schematics indicate the focal plane imaged for the wide-field and TIRF images. Scale bar = 1 μm. (D) Schematic of the experimental setup used in the static biofilm assay in panel E. (E) Biofilm attached to polyvinyl chloride (PVC) coverslips stained with the BacLight LIVE/DEAD stain at different times of a static biofilm assay. The images represent overlays of green (live cells) and red (dead cells) collected by epifluorescence microscopy from the meniscus and bottom of the coverslip. Scale bar = 5 μm. (F) Genetic organization of the putative unipolar polysaccharide (upp) gene cluster (C1_5514 to C1_5522). The locus tag numbers and predicted functions are listed below each arrow. Black arrows indicate the positions of hypothetical proteins. AT, acetyltransferase; GT, glycosyltransferase; MPA-1, membrane-periplasmic-auxiliary protein.
FIG 3
FIG 3
Synchronization of short-stalked P. hirschii cells in the microfluidic device. (A) Fluid layer design of the microfluidic device. A biofilm is formed in the incubation region over 3 days, and the synchronized population is pumped to the analysis channel for observation. (B) Bright-field image of cell confinement in the microfluidic device. The area above the valve seat has cells grow up to, but not beyond, the valve seat. No cells were observed on the opposite side during biofilm growth. Scale bar = 50 μm. (C) Biofilm formation within the incubation region of the microfluidic device. Biofilm is labeled with WGA-AF488, which indicates the presence of the polar polysaccharide. White-light (left), fluorescent (middle), and overlay (right) images are provided. Scale bar = 5 μm. (D) Newborn cells released from the biofilm are motile. Tracks of motile cells were generated with ImageJ ParticleTracker and are overlaid on the false-colored white-light images in the incubation region (left) and the analysis channel (right). Scale bar = 5 μm. (E) Newborn cells rapidly attach to the analysis channel. White-light (left) and fluorescent (right) images of cells labeled with WGA-AF488 attached to the analysis channel 5 (left) and 10 (right) min after collection. The arrowheads indicate the position of a cell that attached within 5 min of collection. Scale bar = 1 μm. (F) Attached cells grow in the analysis channel. Three hours after collection, predivisional cells were observed attached to the analysis channel. Scale bar = 1 μm.
FIG 4
FIG 4
P. hirschii genome reveals signatures of cell cycle regulation. (A) Relative distances of CtrA-binding sites to the ATG of predicted targets. The predicted targets of CtrA regulation in chemotaxis, motility, adhesion, cell growth and division, and regulation are shown. For chemotaxis, all predicted targets are methyl-accepting chemotaxis proteins. Closed circles indicated a perfect match to the TTAAN7TTAA consensus sequence. Open circles have one substitution in the predicted CtrA-binding site. (B) Relative distance of CcrM methylation sites to the ATG of predicted targets in DNA replication, cell division, and regulation. All predicted methylation sites match the GANTC consensus sequence. (C) The P. hirschii origin of replication contains CtrA-binding sites with one substitution (open circles) and multiple CcrM methylation sites (stars). (D) Schematic of genes that may be regulated via putative CtrA binding (solid arrows) or via putative CcrM methylation (dashed arrows), based on the findings in this study. Genes are grouped together according to function. Ori, origin of replication.
FIG 5
FIG 5
Schematic of the short-stalked cell cycle. Sessile cells (S) are attached to a surface by means of a polar polysaccharide (gold) and are capable of elongation. Late predivisional cells (PD) produce a polar or subpolar flagellum. Cell division produces two distinct daughter cells: a motile cell (M) with a flagellum and a sessile cell (S) with a polar polysaccharide.

References

    1. Hallez R, Bellefontaine AF, Letesson JJ, De Bolle X. 2004. Morphological and functional asymmetry in alpha-proteobacteria. Trends Microbiol 12:361–365. doi:10.1016/j.tim.2004.06.002. - DOI - PubMed
    1. Whittenbury R, Dow CS. 1977. Morphogenesis and differentiation in Rhodomicrobium vannielii and other budding and prosthecate bacteria. Bacteriol Rev 41:754–808. - PMC - PubMed
    1. Lam H, Matroule JY, Jacobs-Wagner C. 2003. The asymmetric spatial distribution of bacterial signal transduction proteins coordinates cell cycle events. Dev Cell 5:149–159. doi:10.1016/S1534-5807(03)00191-6. - DOI - PubMed
    1. Hirsch P. 1974. Budding bacteria. Annu Rev Microbiol 28:391–444. doi:10.1146/annurev.mi.28.100174.002135. - DOI - PubMed
    1. Curtis PD, Brun YV. 2010. Getting in the loop: regulation of development in Caulobacter crescentus. Microbiol Mol Biol Rev 74:13–41. doi:10.1128/MMBR.00040-09. - DOI - PMC - PubMed

Publication types

MeSH terms

LinkOut - more resources