. 2016 Feb 1;30(3):321-36.
doi: 10.1101/gad.271882.115.

MLL1 is essential for the senescence-associated secretory phenotype

Affiliations

MLL1 is essential for the senescence-associated secretory phenotype

Brian C Capell et al. Genes Dev. .

Abstract

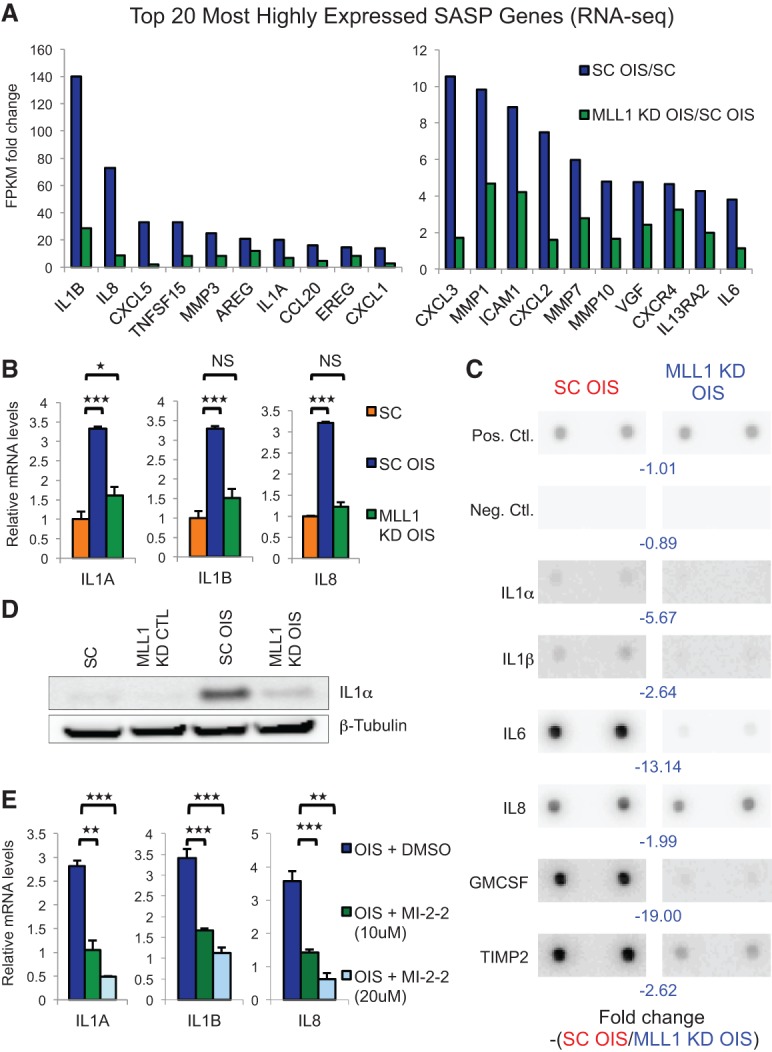
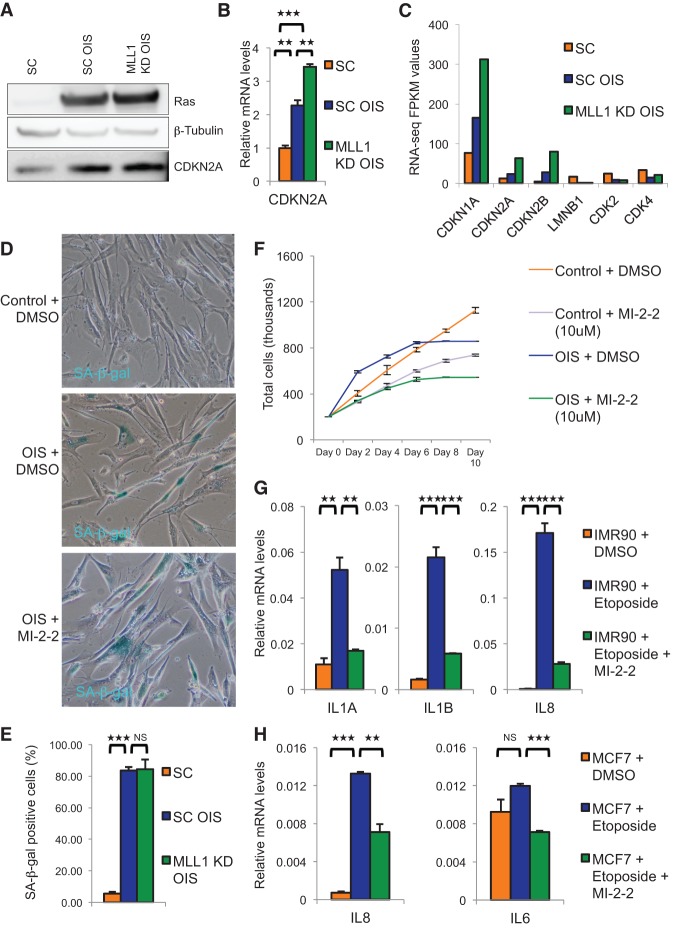
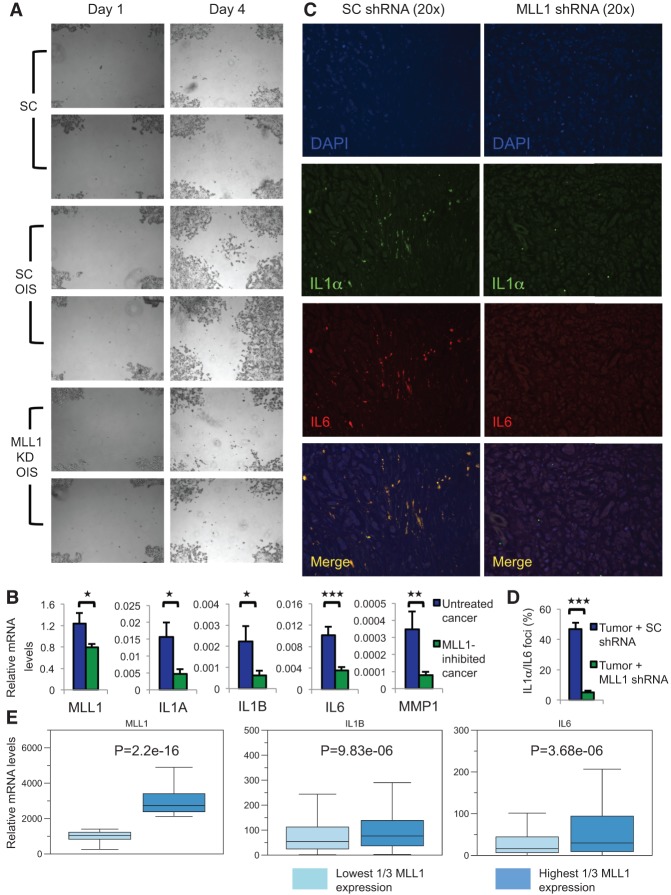
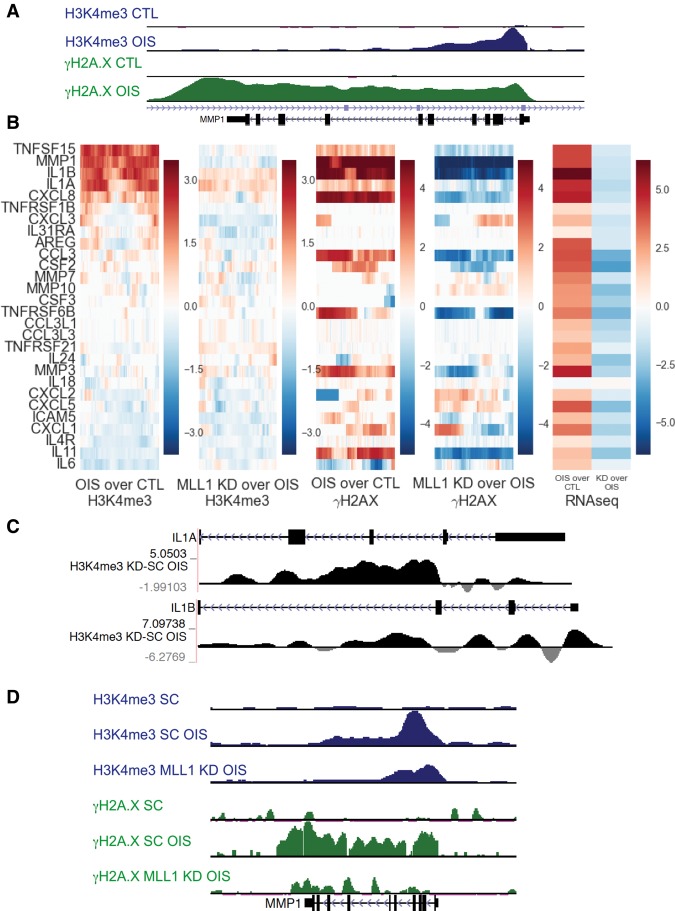
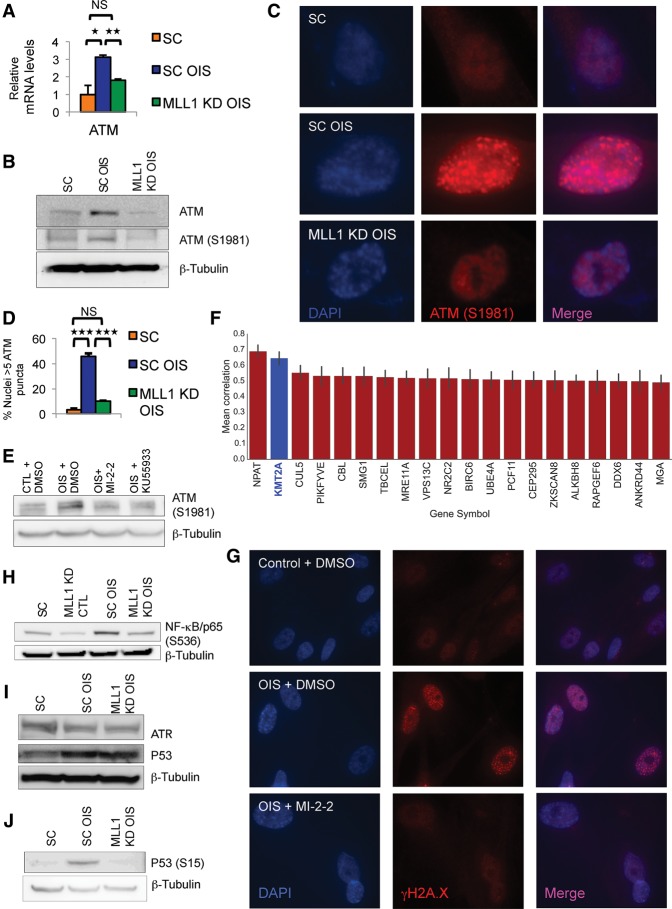
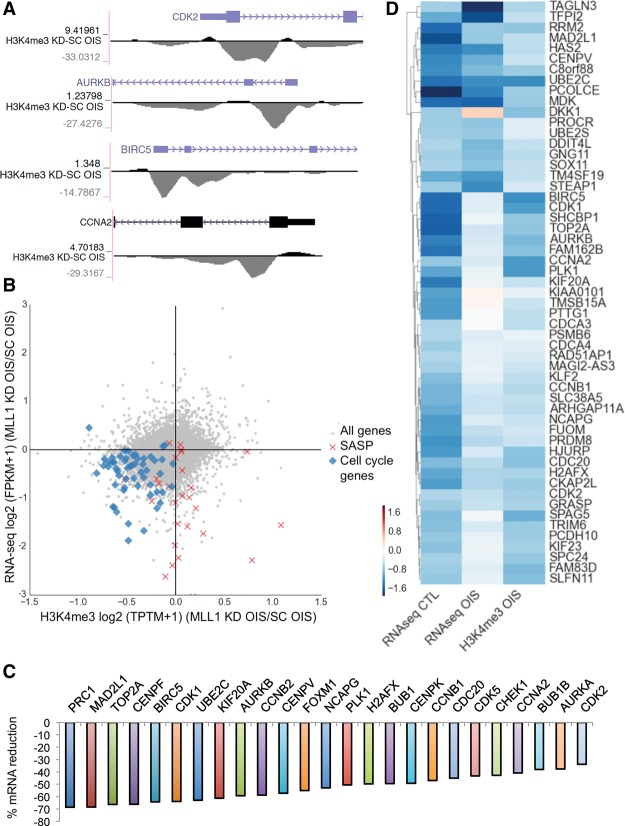
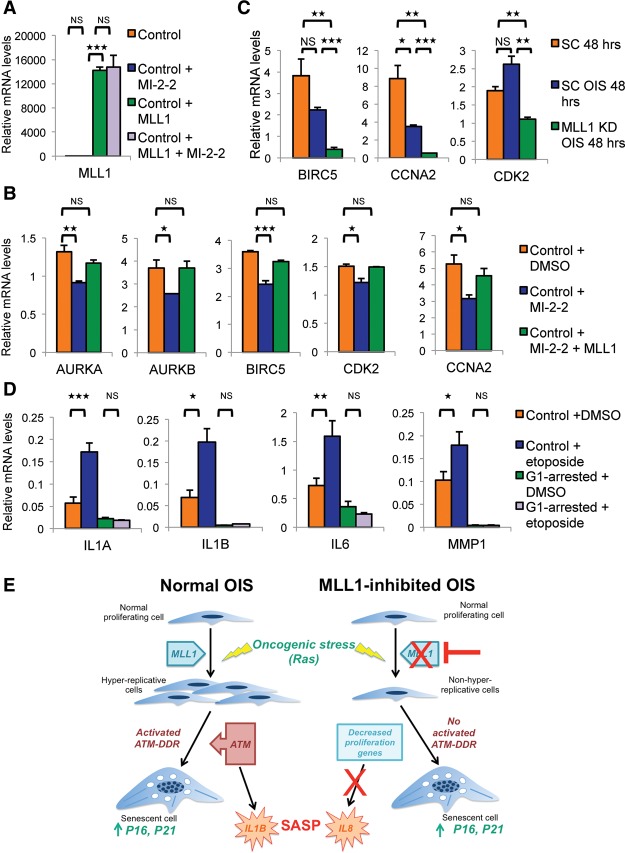
Oncogene-induced senescence (OIS) and therapy-induced senescence (TIS), while tumor-suppressive, also promote procarcinogenic effects by activating the DNA damage response (DDR), which in turn induces inflammation. This inflammatory response prominently includes an array of cytokines known as the senescence-associated secretory phenotype (SASP). Previous observations link the transcription-associated methyltransferase and oncoprotein MLL1 to the DDR, leading us to investigate the role of MLL1 in SASP expression. Our findings reveal direct MLL1 epigenetic control over proproliferative cell cycle genes: MLL1 inhibition represses expression of proproliferative cell cycle regulators required for DNA replication and DDR activation, thus disabling SASP expression. Strikingly, however, these effects of MLL1 inhibition on SASP gene expression do not impair OIS and, furthermore, abolish the ability of the SASP to enhance cancer cell proliferation. More broadly, MLL1 inhibition also reduces "SASP-like" inflammatory gene expression from cancer cells in vitro and in vivo independently of senescence. Taken together, these data demonstrate that MLL1 inhibition may be a powerful and effective strategy for inducing cancerous growth arrest through the direct epigenetic regulation of proliferation-promoting genes and the avoidance of deleterious OIS- or TIS-related tumor secretomes, which can promote both drug resistance and tumor progression.

Keywords: DNA damage response; MLL1; epigenetic; inflammation; oncogene-induced senescence; senescence-associated secretory phenotype.


Figures

Figure 1.
Figure 1.
MLL1 inhibition dramatically attenuates SASP expression. (A) Genome-wide RNA-seq, displayed here as fold change from control (SC) FPKM (fragments per kilobase per million mapped fragments) values, demonstrates a broad and striking reduction in the top 20 most highly up-regulated SASP genes in MLL1 knockdown (KD) OIS cells (green) as compared with the SC OIS cells (blue). (B) RT-qPCR performed in three biological replicates confirms RNA-seq results of some of the most highly expressed SASP genes (comparing MLL1 knockdown OIS cells in green with SC OIS cells in blue). Control “SC” cells are shown in orange. (C) An ELISA array for the most highly up-regulated SASP genes displays decreased secretion of all SASP factors in conditioned medium derived from MLL1 knockdown OIS cells in comparison with SC OIS cell-derived conditioned medium. Image density values were calculated by Licor Image Studio Lite and used to calculate the negative fold change [−(SC OIS/MLL1 knockdown OIS)], which is displayed in blue. (D) Western blotting demonstrates a significant reduction in protein levels of the key upstream SASP mediator IL1α in MLL1 knockdown OIS cells in comparison with SC OIS cells. (E) Pharmacological inhibition of the MLL/Menin interaction with 10 µM MI-2-2 dramatically reduces SASP expression by RT-qPCR in comparison with OIS cells treated with vehicle only (DMSO). Furthermore, treatment with both 10 and 20 µM doses of MI-2-2 demonstrates a dose responsiveness to SASP inhibition. Log values are reported here so that they may be compared on a similar scale.
Figure 2.
Figure 2.
MLL1 inhibition has no effect on OIS growth arrest and blocks DDR-induced inflammation independently of senescence. (A) Western blotting shows that both Ras and CDKN2A/P16 levels are unchanged in MLL1 knockdown (KD) OIS cells in comparison with SC OIS cells. (B) RT-qPCR confirms that CDKN2A mRNA levels increase in MLL1 knockdown OIS cells (green) and are higher than those in SC OIS cells (blue). (C) RNA-seq demonstrates that MLL1 knockdown OIS cells follow transcriptional patterns typically seen in OIS, including increased levels of tumor suppressors CDKN1A, CDKN2A, and CDKN2B as well as decreases in nuclear lamina component LMNB1 and cyclin-dependent kinases CDK2 and CDK4. (D,E) SA-β-gal staining (D) and its quantification (E) show that MI-2-2-treated cells express SA-β-gal in percentages similar to those of normal OIS cells treated with DMSO, while control cells do not. (F) A growth curve analysis demonstrates that MLL1 inhibition by MI-2-2 slows proliferation in both control and OIS cells and prevents the hyperproliferative period typically seen following oncogene induction during the first 48 h of OIS onset. (G) Normal proliferating IMR90 fibroblasts exposed to the DNA-damaging agent etoposide for 48 h are unable to express SASP genes in the setting of a single dose of 10 µM MI-2-2 given at the same time as the etopside, in contrast to DMSO-treated cells. (H) MCF7 human breast cancer cells were likewise treated in the same manner with etoposide and similarly were unable to up-regulate inflammatory cytokines.
Figure 3.
Figure 3.
MLL1 inhibition prevents the procarcinogenic effects of the SASP and inhibits inflammation in cancer in vivo. (A) Cellular proliferation assay of MCF7 breast cancer cells exposed to conditioned medium from either SC cells (top panels), SC OIS cells (middle panels), or MLL1 knockdown (KD) OIS cells (bottom panels) demonstrates that while SC OIS cell medium containing a normal amount of the secreted SASP leads to enhanced cellular growth and migration of this cancer, the medium derived from the MLL1 knockdown OIS cells does not and is more comparable with the SC cells that have no SASP. (B) RT-qPCR of xenograft tumors demonstrates that tumors derived from MLL1 shRNA-treated tumors display significantly less expression of MLL1, IL1A, IL1B, and IL6 as compared with those tumors derived from SC shRNA treatment. (C) Immunofluorescence (IF) (20×) of tumor sections also demonstrates reduced expression of IL1α (green) and IL6 (red) in tumors derived from the MLL1 shRNA-treated tumors as compared with tumors derived from SC shRNA treatment. (D) The average of the quantification of three representative 20× IF fields from tumor sections shows that MLL1-inhibited tumors express significantly fewer foci of IL1α and IL6 than SC shRNA-treated tumors. (E) An examination of 1215 human breast cancer patient samples from The Cancer Genome Atlas (TCGA) demonstrates that the highest one-third of MLL1-expressing tumors have significantly higher SASP expression (IL1B and IL6 shown here) than tumors in the lowest one-third of MLL1 expression.
Figure 4.
Figure 4.
MLL1 inhibition leads to greater losses of γH2A.X than H3K4me3 enrichment over SASP genes. (A) ChIP-seq tracks display dramatic increases in H3K4me3 (blue) over SASP gene promoters and γH2A.X (green) over SASP gene bodies in OIS as compared with control proliferating cells (CTL), as seen here over the SASP gene MMP1. (B) Heat map based on ChIP-seq (first through fourth columns) and RNA-seq (fifth column) of SC, SC OIS, and MLL1 knockdown (KD) OIS cells of all SASP genes demonstrates that many, but not all, SASP genes gain H3K4me3 (as measured over the promoter and TSS) in the transition from proliferating SC cells to OIS (SC OIS) (first column). When comparing H3K4me3 levels by ChIP-seq between SC OIS cells and MLL1 knockdown OIS cells (second column), some SASP genes lose H3K4me3 enrichment in MLL1 knockdown OIS cells, although the changes are not uniform and do not correlate well with expression changes. In contrast, almost all SASP genes demonstrate both increases in γH2A.X enrichment (as measured over the gene body) going from the control (SC) to the OIS (SC OIS) state (third column) as well as decreases in γH2A.X enrichment with MLL1 knockdown in OIS (MLL1 knockdown OIS) (fourth column). (C) Delta track of H3K4me3 ChIP-seq data (MLL1 knockdown OIS/SC OIS) demonstrates representative SASP genes (IL1A and IL1B) that, despite decreasing extensively in expression with MLL1 knockdown, do not lose, but rather actually gain, H3K4me3 enrichment with MLL1 knockdown. (D) ChIP-seq track views over a representative SASP gene (MMP1) display modest decreases in promoter H3K4me3 levels but more extensive losses in gene body γH2A.X levels in MLL1 knockdown OIS cells as compared with SC OIS cells. SC proliferating cell tracks are labeled as SC here.
Figure 5.
Figure 5.
MLL1 inhibition in OIS prevents activation of the ATM–NF-κB signaling axis. (A) ATM mRNA expression is reduced in OIS cells treated with MLL1 shRNA (MLL1 knockdown [KD] OIS; green) as compared with SC OIS cells (blue) as measured by RT-qPCR. SC proliferating cells are in orange. (B) Western blotting shows that MLL1 knockdown OIS cells have reduced levels of both total ATM and activated ATM (phospho-S1981) in comparison with SC OIS cells. (C) IF of MLL1 knockdown OIS cells displays decreased activated ATM (phospho-S1981) nuclear puncta (red) in MLL1 knockdown OIS cells as compared with SC OIS cells. Blue staining indicates DAPI-stained DNA, while pink staining represents the merged image. (D) Quantification of the percentage of cells in SC, SC OIS, and MLL1 knockdown OIS cells with at least five positively staining red nuclear puncta by IF demonstrates a significant reduction in MLL1 knockdown OIS cells. SC OIS compared with SC, P-value = 0.0015; MLL1 knockdown OIS compared with SC OIS, P = 0.0068. (E) ATM (phospho-S1981) protein levels are also reduced by pharmacological treatment with a MLL1/Menin interaction inhibitor, MI-2-2 (10 µM), which prevents its H3K4me3 activity and is similar in efficacy to a targeted inhibitor of phospho-ATM, KU55933 (10 µM). (F) Ranking of the top 20 genes that correlate with ATM expression across all human cancers in TCGA demonstrates that MLL1 is the second most highly correlated gene from the entire genome across all tested cancers, second only to NPAT, which shares a bidirectional promoter with ATM, and ahead of genes with known functional relationships with ATM (SMG1 and MRE11A). (G) IF of OIS cells treated with MI-2-2 displays reduced foci of the DNA damage marker γH2A.X as compared with DMSO-treated OIS cells. (H) NF-κB p65 (phospho-S536), which is downstream from activation of ATM and is a critical SASP transcription factor, was decreased in MLL1 knockdown OIS cells in comparison with SC OIS cells. (I) MLL1 knockdown OIS cells display no differences in total ATR or P53 levels from normal SC OIS cells, suggesting that the effects of MLL1 inhibition are more specific for the ATM-mediated arm of the DDR and not just a global inhibition of the DDR. (J) Consistent with repressed activation of ATM, which phosphorylates P53, P53 (phospho-S15) is decreased in MLL1 knockdown OIS cells as compared with normal SC OIS cells.
Figure 6.
Figure 6.
MLL1 directly regulates the expression of numerous critical proproliferative cell cycle and cancer target genes. (A) ChIP-seq delta track (MLL1 knockdown [KD] OIS/SC OIS) of H3K4me3 enrichment at the genes CDK2, AURKB, BIRC5, and CCNA2 demonstrates extensive losses of H3K4me3 at the promoter of both genes in MLL1 knockdown OIS cells. (B) Scatter plot of the log ratio of H3K4me3 enrichment (ChIP-seq) and gene expression (RNA-seq) of MLL1 knockdown OIS/SC OIS demonstrates that proproliferative cell cycle and cancer target genes (blue dots) lose both expression and H3K4me3 enrichment in comparison with SASP genes (red Xs) and all other genes (gray dots). (C) RNA-seq of MLL1 knockdown in normal control proliferating IMR90s (MLL1 knockdown CTL) in comparison with SC cells demonstrates extensive loss of expression of key proproliferative cell cycle and cancer target genes (genes derived from the top 500 genes that lost expression genome-wide, displayed as the percentage of expression lost with MLL1 knockdown). (D) The relative levels of change for the 57 genes that were identified from the intersection of the top 500 genes with the most decreased H3K4me3 enrichment (ChIP-seq) in MLL1 knockdown in OIS cells (MLL1 knockdown OIS) as well as the top 500 genes with the most reduced expression (RNA-seq) with MLL1 knockdown in control cells (MLL1 knockdown CTL) are displayed in heat map form. The first column displays the fold change of loss of expression in control cells with MLL1 knockdown by RNA-seq. The second column displays the loss of expression in OIS cells with MLL1 knockdown by RNA-seq. The third column displays the loss of H3K4me3 in OIS cells with MLL1 knockdown by ChIP-seq. Relative change of H3K4me3 over ±1 kb of the TSS is shown. Euclidean distance with ward metric hierarchical clustering was used.
Figure 7.
Figure 7.
(A) MLL1 overexpression by transient transfection over 48 h demonstrates significant up-regulation by >10,000-fold of MLL1 by RT-qPCR as compared with vector control transfection. Notably, 10 µM MI-2-2 treatment has no effect on levels of MLL1. (B) Normal control IMR90 cells were transfected with either a vector control or MLL1 overexpression plasmid in the setting of either a single dose of DMSO or 10 µM MI-2-2. After 48 h, RT-qPCR was performed and demonstrated that MLL1 overexpression either partially or fully rescued the expression of proproliferative cell cycle genes AURKA, AURKB, BIRC5, CCNA2, and CDK2, suggesting that MLL1 has a direct role in regulating their expression. (C) Examination of the expression of proproliferative cell cycle genes 48 h after induction of OIS by RT-qPCR demonstrates that MLL1 knockdown (KD) OIS cells have dramatically decreased levels of mRNA of these genes after just 48 h, even in comparison with SC OIS cells. This 48-h period reflects the early hyperproliferative and hyperreplicative phase prior to OIS onset that is required for DDR activation. Consistent with this, CDK2 is actually elevated at this time in SC OIS cells in comparison with SC cells but is significantly decreased already in MLL1 knockdown OIS cells. (D) Cells arrested in G1 phase by serum starvation are unable to up-regulate SASP-like inflammatory genes when exposed to DNA-damaging chemotherapy such as etoposide, consistent with previous data showing that S phase is required in order to activate the DDR (Di Micco et al. 2006). (E) Schematic representation of how MLL1 inhibition (right side) blocks SASP expression by directly inhibiting the expression of numerous proproliferative cell cycle genes, thus preventing the required hyperproliferative and hyperreplicative phase necessary for activation of the ATM-mediated DDR and its resulting SASP, in comparison with normal OIS cells (left side). Despite this lack of DDR, MLL1-inhibited cells still undergo normal tumor-suppressive growth arrest.

Similar articles

Cited by

References

    1. Acosta JC, Banito A, Wuestefeld T, Georgilis A, Janich P, Morton JP, Athineos D, Kang TW, Lasitschka F, Andrulis M, et al. 2013. A complex secretory program orchestrated by the inflammasome controls paracrine senescence. Nat Cell Biol 15: 978–990. - PMC - PubMed
    1. Agger K, Cloos PA, Rudkjaer L, Williams K, Andersen G, Christensen J, Helin K. 2009. The H3K27me3 demethylase JMJD3 contributes to the activation of the INK4A–ARF locus in response to oncogene- and stress-induced senescence. Genes Dev 23: 1171–1176. - PMC - PubMed
    1. Algire C, Moiseeva O, Deschenes-Simard X, Amrein L, Petruccelli L, Birman E, Viollet B, Ferbeyre G, Pollak MN. 2012. Metformin reduces endogenous reactive oxygen species and associated DNA damage. Cancer Prev Res 5: 536–543. - PubMed
    1. Barradas M, Anderton E, Acosta JC, Li S, Banito A, Rodriguez-Niedenfuhr M, Maertens G, Banck M, Zhou MM, Walsh MJ, et al. 2009. Histone demethylase JMJD3 contributes to epigenetic control of INK4a/ARF by oncogenic RAS. Genes Dev 23: 1177–1182. - PMC - PubMed
    1. Blobel GA, Kadauke S, Wang E, Lau AW, Zuber J, Chou MM, Vakoc CR. 2009. A reconfigured pattern of MLL occupancy within mitotic chromatin promotes rapid transcriptional reactivation following mitotic exit. Mol Cell 36: 970–983. - PMC - PubMed

Publication types

MeSH terms