Clinical Trial
. 2016 May;18(5):491-9.
doi: 10.1111/dom.12639. Epub 2016 Mar 1.

Exposure-response analyses of liraglutide 3.0 mg for weight management

Affiliations
Clinical Trial

Exposure-response analyses of liraglutide 3.0 mg for weight management

J P H Wilding et al. Diabetes Obes Metab. 2016 May.

Abstract

Aims: Liraglutide 3.0 mg, an acylated GLP-1 analogue approved for weight management, lowers body weight through decreased energy intake. We conducted exposure-response analyses to provide important information on individual responses to given drug doses, reflecting inter-individual variations in drug metabolism, absorption and excretion.

Methods: We report efficacy and safety responses across a wide range of exposure levels, using data from one phase II (liraglutide doses 1.2, 1.8, 2.4 and 3.0 mg), and two phase IIIa [SCALE Obesity and Prediabetes (3.0 mg); SCALE Diabetes (1.8; 3.0 mg)] randomized, placebo-controlled trials (n = 4372).

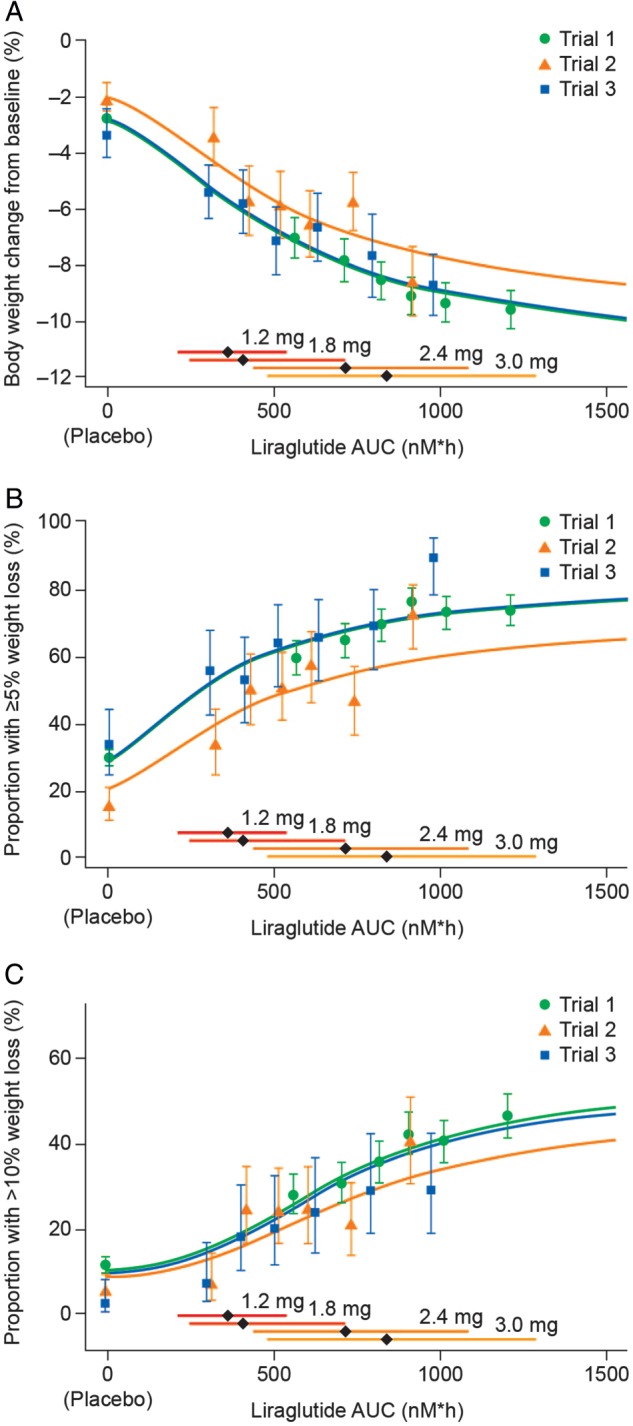
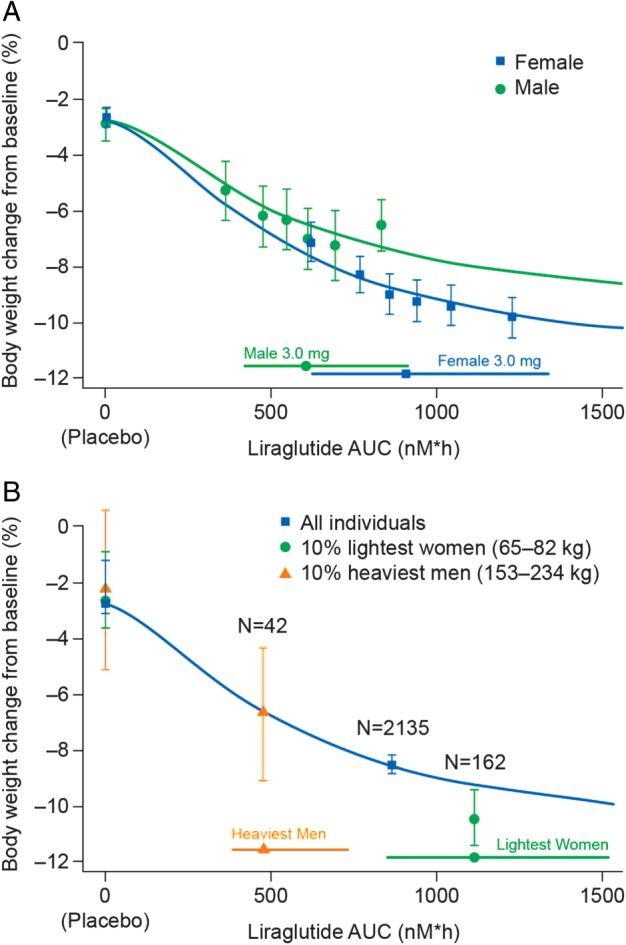
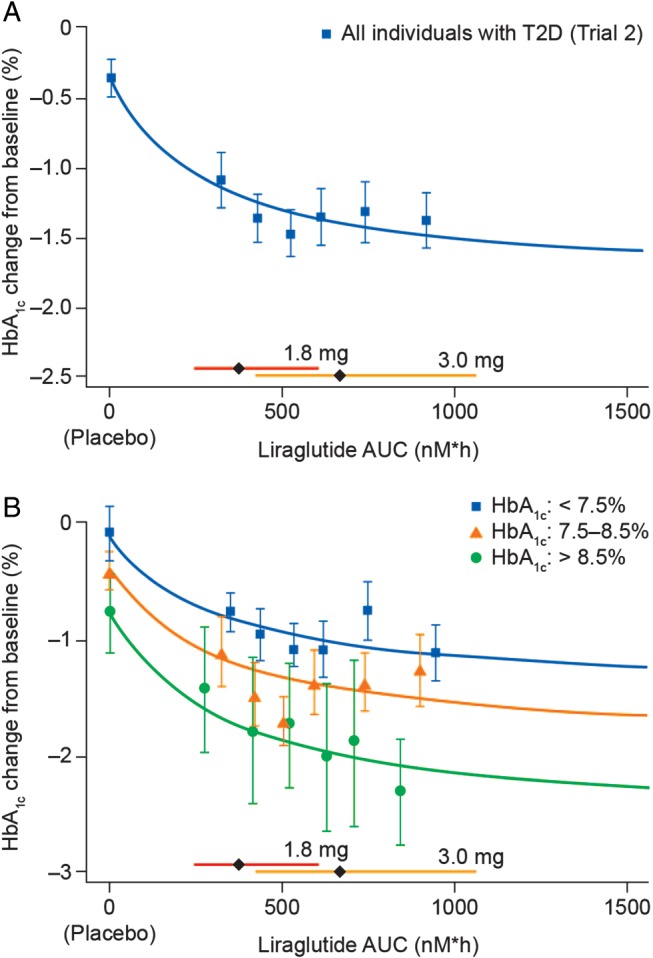
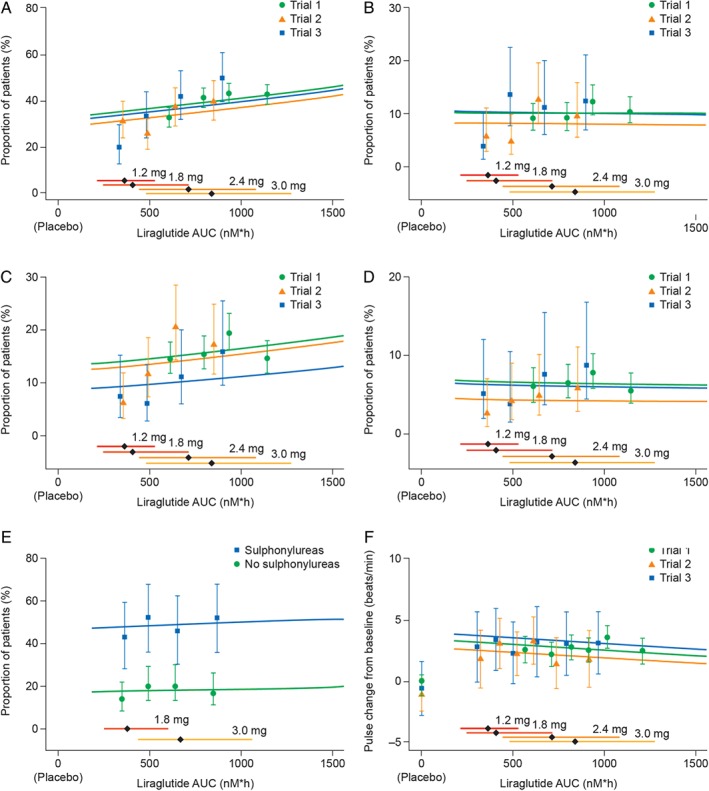
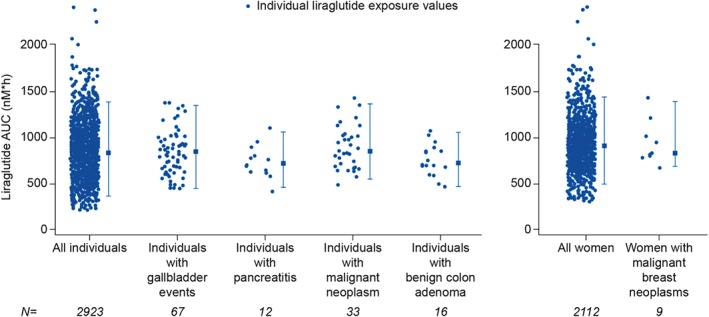
Results: There was a clear exposure-weight loss response. Weight loss increased with greater exposure and appeared to level off at the highest exposures associated with liraglutide 3.0 mg in most individuals, but did not fully plateau in men. In individuals with overweight/obesity and comorbid type 2 diabetes, there was a clear exposure-glycated haemoglobin (HbA1c) relationship. HbA1c reduction increased with higher plasma liraglutide concentration (plateauing at ∼21 nM); however, for individuals with baseline HbA1c >8.5%, HbA1c reduction did not fully plateau. No exposure-response relationship was identified for any safety outcome, with the exception of gastrointestinal adverse events (AEs). Individuals with gallbladder AEs, acute pancreatitis or malignant/breast/benign colorectal neoplasms did not have higher liraglutide exposure compared with the overall population.

Conclusions: These analyses support the use of liraglutide 3.0 mg for weight management in all subgroups investigated; weight loss increased with higher drug exposure, with no concomitant deterioration in safety/tolerability besides previously known gastrointestinal side effects.

Keywords: body weight; glucagon-like peptide-1; incretin; pharmacokinetic.


Figures

Figure 1
Figure 1
Liraglutide exposure and body weight loss. Liraglutide exposure expressed as model‐derived area under the curve (AUC) at steady‐state versus body weight loss. (A) Exposure versus body weight change from baseline; (B) exposure versus proportion of individuals with ≥5% weight loss from baseline; (C) exposure versus proportion of individuals with >10% weight loss from baseline. Data are mean values (with 95% confidence intervals) versus exposure expressed as six quantiles of area under the curve (AUC) values (plus placebo). Sigmoidal curved lines represent covariate‐adjusted model‐based estimates for each trial population. Horizontal bars with diamonds represent median and 90% exposure ranges from each dose level. Trial 1, SCALE Obesity and Prediabetes; Trial 2, SCALE Diabetes; Trial 3, the phase II trial.
Figure 2
Figure 2
Liraglutide exposure and body weight loss in men and women. Liraglutide exposure expressed as model‐derived area under the curve (AUC) at steady state versus body weight change from baseline (A) for men and women in Trials 1–3 combined (covariate adjusted values); (B) for men and women at the extremes of exposure. Body weight data are mean values (with 95% confidence intervals). Horizontal bars with circles/squares/triangles represent median and 90% exposure ranges from each dose level (A), or from men and women at the extremes of exposure (B). Sigmoidal curved lines represent covariate‐adjusted model‐based estimates for defined populations. (A) Exposure expressed as six quantiles of AUC values (plus placebo). (B) Exposure and weight change for the placebo‐ or liraglutide‐treated heaviest men and lightest women, as well as the overall cohort mean in Trial 1. Trial 1, SCALE Obesity and Prediabetes; Trial 2, SCALE Diabetes; Trial 3, the phase II trial.
Figure 3
Figure 3
Liraglutide exposure and glycated haemoglobin (HbA1c). Exposure expressed as model‐derived area under the curve (AUC) at steady‐state versus HbA1c change from baseline (A) in individuals with overweight or obesity and type 2 diabetes (Trial 2); (B) in individuals with overweight or obesity and type 2 diabetes, stratified by baseline HbA1c (Trial 2). Data are mean values (with 95% confidence interval) versus exposure expressed as six quantiles of AUC values (plus placebo). Sigmoidal curved lines represent covariate‐adjusted model‐based estimates for each trial population. Horizontal bars with diamonds represent median and 90% exposure ranges from each dose level. T2D, type 2 diabetes.
Figure 4
Figure 4
Liraglutide exposure and key safety outcomes. Liraglutide exposure expressed as model‐derived area under the curve (AUC) at steady‐state versus key safety outcomes, proportion of participants with (A) all incidences of nausea; (B) moderate–severe nausea; (C) all incidences of vomiting; (D) moderate–severe vomiting; (E) documented symptomatic hypoglycaemia (glucose ≤ 70 mg/dl); (F) change from baseline in mean resting pulse. Data are proportion of individuals who report an event at any time during the trial (A–E) or mean change in pulse from baseline (F), all with 95% confidence interval, versus exposure (in quantiles of AUC). Lines (exposure–response relationship for each trial) represent a multivariate regression analysis for the pooled data. Horizontal bars with diamonds represent median and 90% exposure ranges. Liraglutide doses were: 3.0 mg in Trial 1; 1.8 and 3.0 mg in Trial 2; 1.2 mg, 1.8 mg, 2.4 mg and 3.0 mg in Trial 3. Trial 1, SCALE Obesity and Prediabetes; Trial 2, SCALE Diabetes; Trial 3, the phase II trial.
Figure 5
Figure 5
Liraglutide exposure in individuals with adverse events of special interest. Each circular data point represents an individual and the corresponding liraglutide exposure value [model‐derived area under the curve (AUC) at steady‐state for the target dose]; vertical error bars show the 95% exposure range; the square represents the median for each group. Off‐treatment events are included for all categories, with the exception of gallbladder‐related adverse events (AEs). Gallbladder‐related AEs include treatment‐emergent events [0–58 weeks (Trials 1 and 2), or within 0–21 weeks (Trial 3), or up to the end of treatment if discontinued prematurely]; adjudicated pancreatitis and neoplasms include events reported on or off‐treatment through 11 November 2013 (database lock for 120‐day safety update to US Food and Drug Administration).

Similar articles

Cited by

References

    1. Göke R, Larsen PJ, Mikkelsen JD, Sheikh SP. Distribution of GLP‐1 binding sites in the rat brain: evidence that exendin‐4 is a ligand of brain GLP‐1 binding sites. Eur J Neurosci 1995; 7: 2294–2300. - PubMed
    1. Turton MD, O'Shea D, Gunn I et al. A role for glucagon‐like peptide‐1 in the central regulation of feeding. Nature 1996; 379: 69–72. - PubMed
    1. Flint A, Raben A, Astrup A, Holst JJ. Glucagon‐like peptide 1 promotes satiety and suppresses energy intake in humans. J Clin Invest 1998; 101: 515–520. - PMC - PubMed
    1. Merchenthaler I, Lane M, Shughrue P. Distribution of pre‐pro‐glucagon and glucagon‐like peptide‐1 receptor messenger RNAs in the rat central nervous system. J Comp Neurol 1999; 403: 261–280. - PubMed
    1. Flint A, Raben A, Ersbøll AK, Holst JJ, Astrup A. The effect of physiological levels of glucagon‐like peptide‐1 on appetite, gastric emptying, energy and substrate metabolism in obesity. Int J Obes Relat Metab Disord 2001; 25: 781–792. - PubMed

Publication types

MeSH terms