. 2016 Sep;60(9):1967-83.
doi: 10.1002/mnfr.201500321. Epub 2016 Jul 6.

Establishment and use of new MDCK II cells overexpressing both UGT1A1 and MRP2 to characterize flavonoid metabolism via the glucuronidation pathway

Affiliations

Establishment and use of new MDCK II cells overexpressing both UGT1A1 and MRP2 to characterize flavonoid metabolism via the glucuronidation pathway

Meifang Wang et al. Mol Nutr Food Res. 2016 Sep.

Abstract

Scope: The purpose of this study is to characterize how overexpression of an efflux transporter and an UDP-glucuronosyltransferase (UGT) affects the cellular kinetics of glucuronidation processes.

Methods and results: A new MDCK II cell line overexpressing both MRP2 and UGT1A1 (MDCKII-UGT1A1/MRP2 cells) was developed and used to determine how overexpression of an efflux transporter affects the kinetics of cellular flavonoid glucuronide production. The results showed that most model flavonoids (from a total of 13) were mainly metabolized into glucuronides in the MDCKII-UGT1A1/MRP2 cells and the glucuronides were rapidly excreted. Flavonoids with three or fewer hydroxyl group at 7, 3' or 6 hydroxyl group were also metabolized into sulfates. Mechanistic studies using 7-hydroxylflavone showed that its glucuronide was mainly (90%) effluxed by BCRP with a small (10%) but significant contribution from MRP2. Maximal velocity of glucuronide production MDCK-MRP2/UGT1A1 cells showed a fairly good correlation (R(2) >0.8) with those derived using UGT1A1 microsomes, but other kinetic parameters (e.g., Km ) did not correlate.

Conclusion: Overexpression of a second efficient efflux transporter did not significantly change the fact that BCRP is the dominant transporter for flavonoid glucuronide nor did it diminish the influence of the efflux transporter as the "gate keeper" of glucuronidation process.

Keywords: Efflux transporters; Flavonoids; Glucuronide; UGT; “Revolving door”.


Figures

Fig. 1
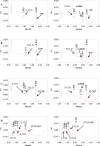
Fig. 1. Representative UPLC chromatograms of flavones and their metabolites in expressed UGT1A1 or UGT1A1 Supersomes (left) or UGT1A1 and MRP2 overexpressing MDCK II cells or MDCKII-UGT1A1/MRP2cells (right)
Chromatograms were derived from 7HF (at 312nm, Panels A), 6HF (at 306nm, Panel B), 33′DHF (at 345nm, Panel C), 373′4′QHF (at 361nm, Panel D) and Quercetin (at 372nm, Panel E), respectively. Left panel samples were from enzyme assay in which 5μm substrate was incubated with 52.9μg/ml UGT1A1 Supersome for 30mins. Right panel samples were from MDCKII-UGT1A1/MRP2cells assay in which the substrate concentration was 5μm and the incubation time was 4h. These chromatograms were chosen because glucuronidation of these five flavonoids by UGT1A1 microsomes were done the first time in our lab. Other results of expressed UGT1A1-mediated metabolism of flavonoids were published already.
Fig. 2
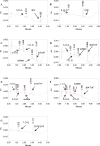
Fig. 2. Representative UPLC chromatograms of flavones and their metabolites in MDCKII-UGT1A1/MRP2cells that were not shown in Fig. 1
Chromatograms were derived from 3HF (at 342nm, Panel A), 4′HF (at 333nm, Panel B), 37DHF (at 340nm, Panel C), 357THF (at 340nm, Panel D), 374′THF (at 354nm, Panel E), 364′THF (at 354nm, Panel F), and 3574′QHF (at 366nm, Panel G), respectively. Samples were from MDCKII-UGT1A1/MRP2 cells assay in which the substrate concentration was 5μm and the incubation time was 4h.
Fig. 3
Fig. 3. Western blot and activity analysis of UGT1A1 expression in MDCKII-UGT1A1/MRP2cells
Fig. 3A; Top stripe, UGT1A1 antibody results, and Bottom stripe, β-actin antibody results. Lane 1 was MDCK II MRP2 cells, lane 2 was the MDCK II MRP2 cells overexpressing UGT1A1, and lanes 3 was commercially available human recombinant UGT1A1 microsomes (approximately 2 ug) used as positive antibody control. Fig. 3B; Relative formation rates of 3′HF glucuronides in MDCKII-UGT1A1/MRP2cells, when 10 uM of 3′HF was used as a substrate.
Fig. 4
Fig. 4. Effects of Efflux Transporter Inhibitors on the Efflux of 7HF-O-G and 7HF-O-S from MDCKII-MRP2/UGT1A1 cells
Experiments were conducted in six-well plates, which meant a surface area of approximately 20 cm2 and protein amount of 0.8 mg/monolayer. Effects of BCRP inhibitors Ko143 (5 μM) and siRNA (2 ug per monolayer) on glucuronide (Fig. 4A) and sulfate (Fig. 4C) efflux was determined using 10 μM 7HF, which was both glucuronidated and sulfated in these cells. Effects of MRP2 inhibitors MK-571 (20 μM) and siRNA (2 ug per monolayer) on glucuronide (Fig. 4B) and sulfate (Fig. 4D) efflux was also determined using 10 μM 7HF. 7HF was loaded onto the cells simultaneously with chemical inhibitors in chemical inhibitor (alone) study. In siRNA knockdown study, cells were treated with siRNA (2 ug per monolayer) in the presence of Lipofectamine (1 μl per monolayer) per manufacturer’s instruction for 48 hr prior to loading 7HF. In experiments where both chemical inhibitors and siRNA was used, siRNA was used first and then 7HF along with chemical inhibitors were then used.
Fig. 5
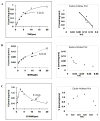
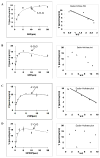
Fig. 5. Kinetics profiles of expressed UGT1A1-mediated glucuronidation of five flavones (7HF, 6HF, 33′HF, 373′4′QHF and Quercetin)
The concentrations versus rates plots were on the left panels and the corresponding Eadie-Hofstee plots were present on the right panels. Profiles were for 7-O-glucuronidation of 7HF (Panel A), 6-O-glucuronidation of 6HF (Panel B), 3′-O-glucuronidation of 3,3′-DHF (Panel C), 7-O-glucuronidation of 3,7,3′,4′-QHF (Panel D), 4′-O-glucuronidation of 3,7,3′,4′-QHF (Panel E), 3′-O-glucuronidation of 3,7,3′,4′-QHF (Panel F), 7-O-glucuronidation of quercetin (Panel G), 4′-O-glucuronidation of quercetin (Panel H), and 3′-O-glucuronidation of quercetin (Panel I), respectively. Each data represents the average of triplicates, and error bars are the standard deviations of the mean (n=3)
Fig. 6
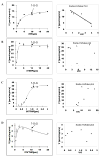
Fig. 6. Kinetics profiles of MRP2–mediated efflux of 7-O-glucuronides of five flavonoids (7HF, 37DHF, 357THF, 374′THF, and 3574′QHF) in MDCKII-UGT1A1/MRP2cells
The concentrations (in extracellular incubating media) versus rates plots were on the left panels and the corresponding Eadie-Hofstee plots were on the right panels. Profiles were for the cellular excretion of 7-O-glucuronide of 7HF (Panel A), 7-O-glucuronide of 3,7DHF (Panel B), 7-O-glucuronide of 3,5,7THF (Panel C), 7-O-glucuronide of 3,7,4′-THF (Panel D), and 7-O-glucuronide of 3,5,7,4′-QHF (Panel E), respectively. Each data represents the average of triplicates, and error bars are the standard deviations of the mean (n=3).
Fig. 7
Fig. 7. Kinetics profiles of MRP2-mediated efflux of non 7-O-glucuronides of nine flavones (3HF, 6HF, 4′HF, 33′DHF, 37DHF, 364′THF, 374′THF, 373′4′QHF and Quercetin) in MDCKII-UGT1A1/MRP2 cells
Profiles were for the cellular excretion of 3-O-glucuronide of 3HF (Panel A), 6-O-glucuronide of 6HF (Panel B), 4′-O-glucuronide of 4′HF (Panel C), 3′-O-glucuronide of 3,3′-DHF (Panel D), and 3-O-glucuronide of 3,7-DHF (Panel E), 3-O-glucuronide of 3,6,4′THF (Panel F), 6-O-glucuronide of 3,6,4′THF (Panel G), 4′-O-glucuronide of 3,6,4′-THF (Panel H), 3-O-glucuronide of 3,7,4′-THF(Panel I), 3′-O-glucuronide of 3,7,3′,4′-QHF (Panel J), and 3′-O-glucuronide of quercetin (Panel K), respectively. The concentrations (in extracellular incubating media) versus efflux rates plots were on the left panels and the corresponding Eadie-Hofstee plots were on the right panels. Each data represents the average of triplicates, and error bars are the standard deviations of the mean (n=3).
Fig. 8
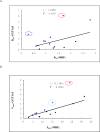
Fig. 8. Scatter plots of kinetic parameters derived from UGT1A1 and MDCKII-UGT1A1/MRP2cells
Kinetic parameters (Km, Jmax, and Log(CLint) derived from MDCKII-UGT1A1/MRP2whole cell experiments were plot against those derived from UGT1A1-mediated glucuronidation (Km′, Vmax′, and Log(CLint)′ ). Values derived from cells were always presented as the X values and those from the microsomes as Y values. A, the Km vs Km′ plot; B, Jmax vs Vmax′; C, Log(CLint) vs Log(CLint)′. Two data points not used in the calculation of correlation coefficients were circled, and represented the kinetic parameters associated with 3′-O-glucuornides of 33′DHF (red circle) and 373′4QHF (blue circle).

Similar articles

Cited by

References

    1. Fedejko B, Mazerska Z. UDP-glucuronyltransferases in detoxification and activation metabolism of endogenous compounds and xenobiotics. Postepy Biochem. 2011;57:49–62. - PubMed
    1. Wei Y, et al. Revolving door action of breast cancer resistance protein (BCRP) facilitates or controls the efflux of flavone glucuronides from UGT1A9-overexpressing HeLa cells. Mol Pharm. 2013;10:1736–1750. - PMC - PubMed
    1. Wu B, Morrow JK, Singh R, Zhang S, Hu M. Three-dimensional quantitative structure-activity relationship studies on UGT1A9-mediated 3-O-glucuronidation of natural flavonols using a pharmacophore-based comparative molecular field analysis model. J Pharmacol Exp Ther. 2011;336:403–413. - PMC - PubMed
    1. Radominska-Pandya A, Bratton S, Little JM. A historical overview of the heterologous expression of mammalian UDP-glucuronosyltransferase isoforms over the past twenty years. Curr Drug Metab. 2005;6:141–160. - PubMed
    1. Wu B, Kulkarni K, Basu S, Zhang S, Hu M. First-pass metabolism via UDP-glucuronosyltransferase: a barrier to oral bioavailability of phenolics. J Pharm Sci. 2011;100:3655–3681. - PMC - PubMed

MeSH terms