. 2016 Mar 17;127(11):1426-37.
doi: 10.1182/blood-2015-10-673749. Epub 2016 Feb 1.

Functional and molecular characterization of mouse Gata2-independent hematopoietic progenitors

Affiliations

Functional and molecular characterization of mouse Gata2-independent hematopoietic progenitors

Polynikis Kaimakis et al. Blood. .

Abstract

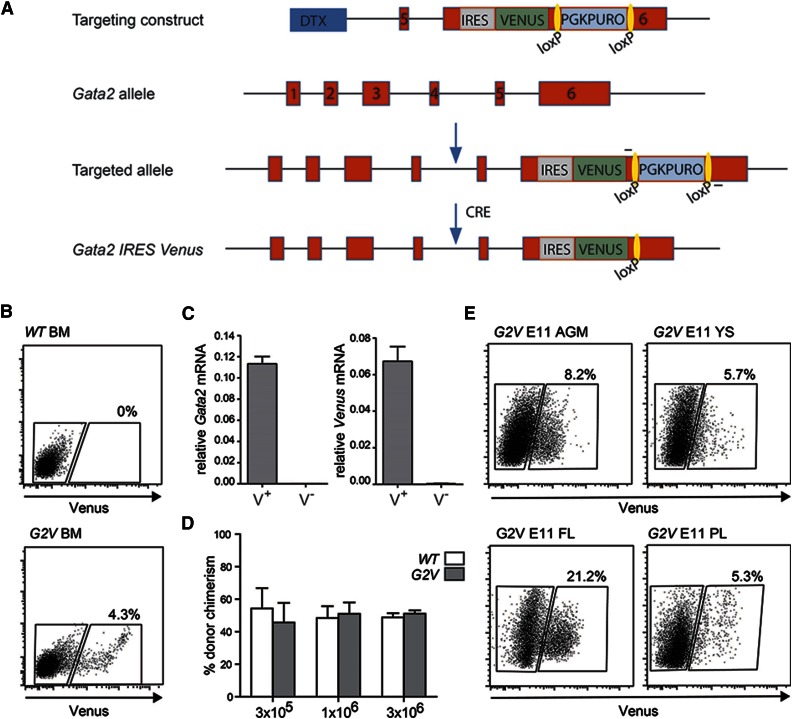
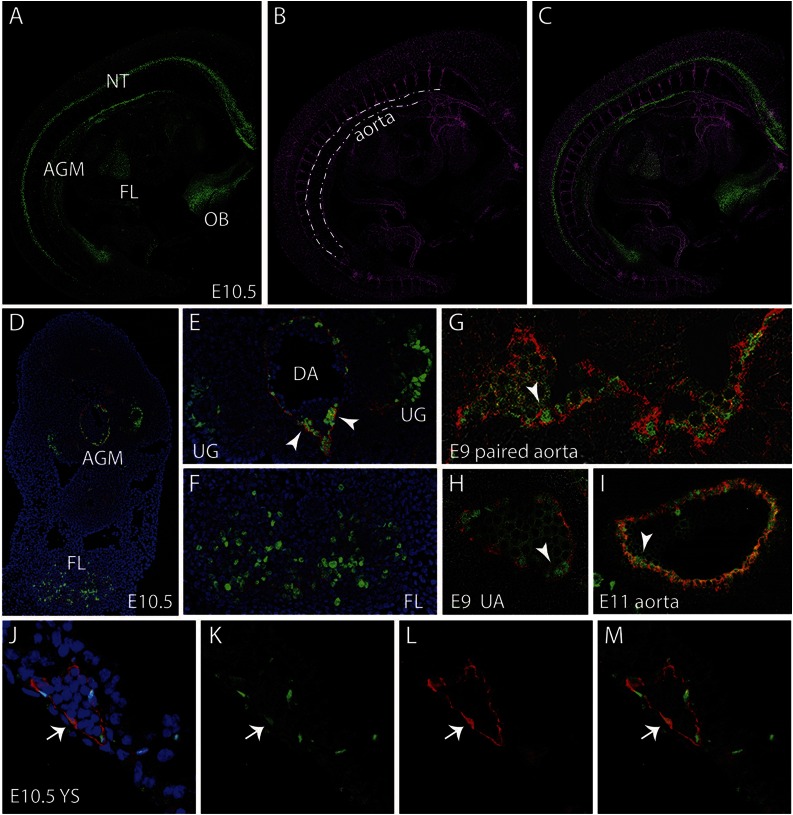
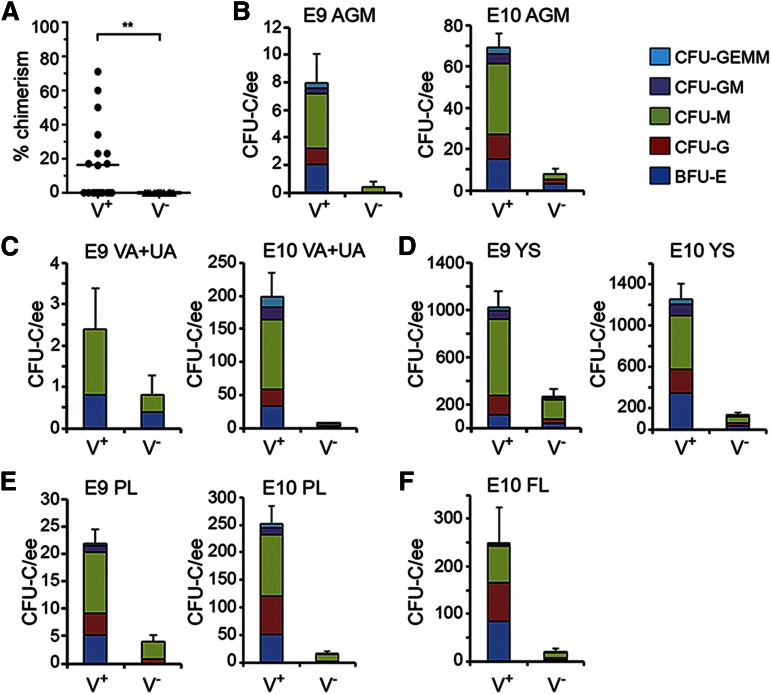
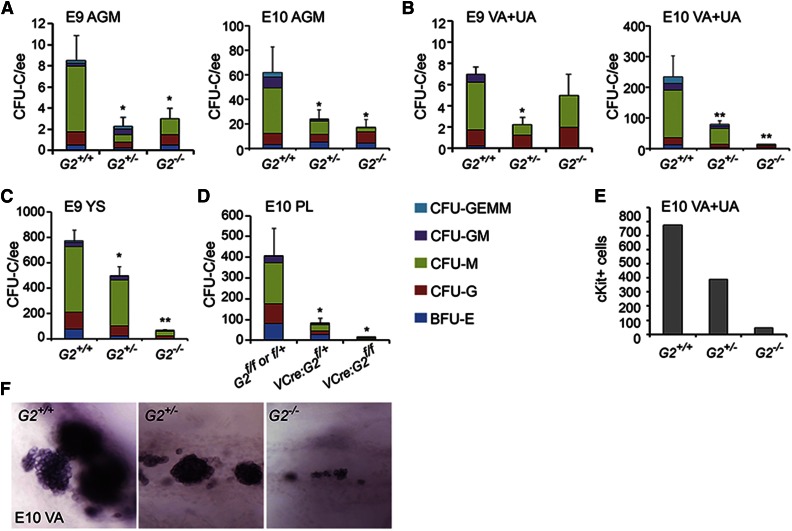
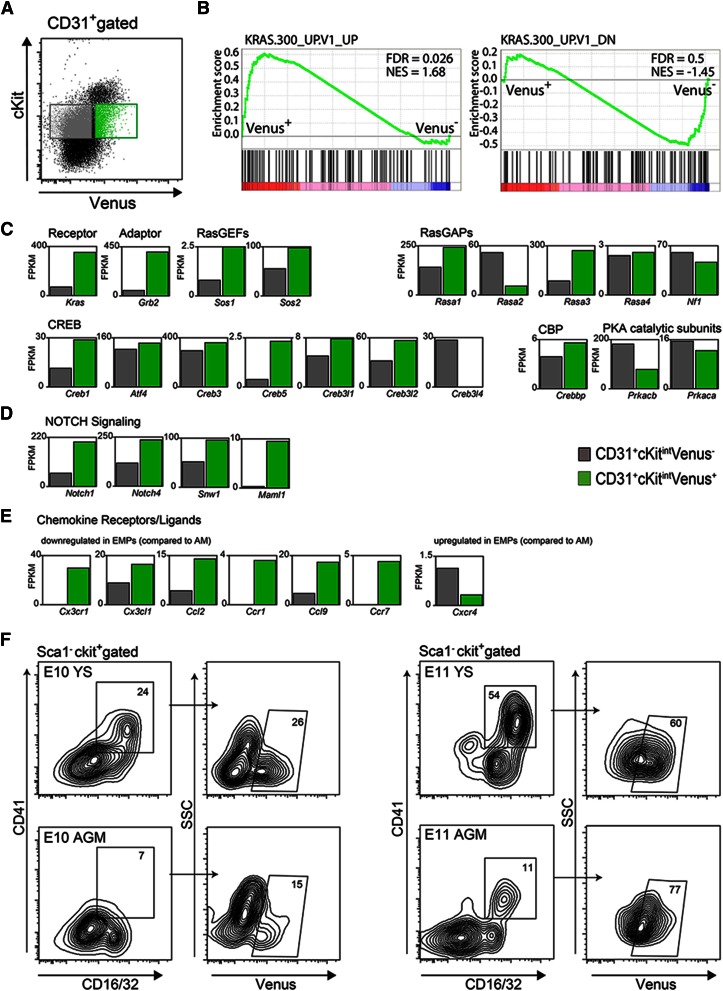
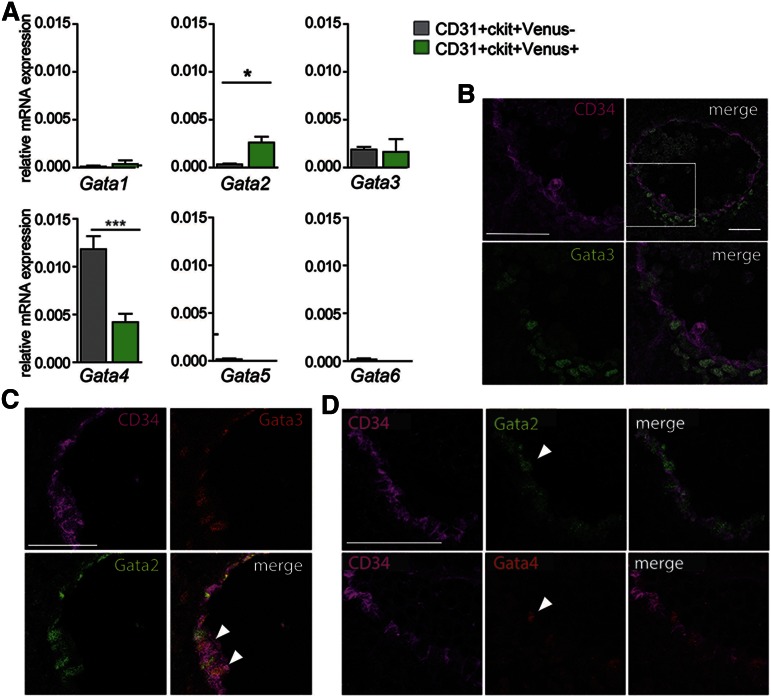
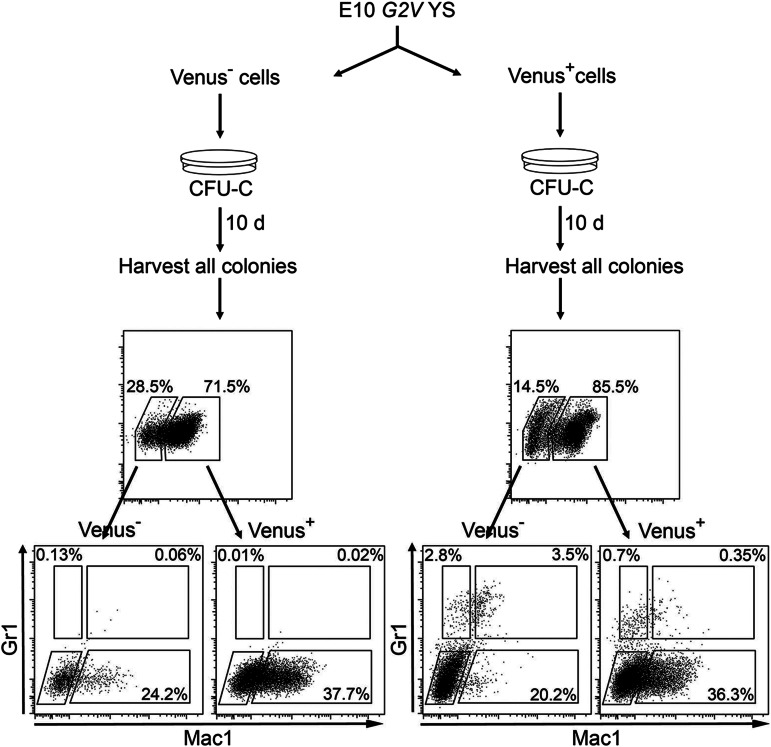
The Gata2 transcription factor is a pivotal regulator of hematopoietic cell development and maintenance, highlighted by the fact that Gata2 haploinsufficiency has been identified as the cause of some familial cases of acute myelogenous leukemia/myelodysplastic syndrome and in MonoMac syndrome. Genetic deletion in mice has shown that Gata2 is pivotal to the embryonic generation of hematopoietic stem cells (HSCs) and hematopoietic progenitor cells (HPCs). It functions in the embryo during endothelial cell to hematopoietic cell transition to affect hematopoietic cluster, HPC, and HSC formation. Gata2 conditional deletion and overexpression studies show the importance of Gata2 levels in hematopoiesis, during all developmental stages. Although previous studies of cell populations phenotypically enriched in HPCs and HSCs show expression of Gata2, there has been no direct study of Gata2 expressing cells during normal hematopoiesis. In this study, we generate a Gata2Venus reporter mouse model with unperturbed Gata2 expression to examine the hematopoietic function and transcriptome of Gata2 expressing and nonexpressing cells. We show that all the HSCs are Gata2 expressing. However, not all HPCs in the aorta, vitelline and umbilical arteries, and fetal liver require or express Gata2. These Gata2-independent HPCs exhibit a different functional output and genetic program, including Ras and cyclic AMP response element-binding protein pathways and other Gata factors, compared with Gata2-dependent HPCs. Our results, indicating that Gata2 is of major importance in programming toward HSC fate but not in all cells with HPC fate, have implications for current reprogramming strategies.


Figures

Figure 1
Figure 1
Gata2 Venus reporter construction and validation. (A) Schematic diagram of the IRES Venus reporter selection cassette insertion in the 3′UTR of the mouse Gata2 locus and Cre-mediated removal of lox PGK-Puro lox. Primers used for detection of the targeted and recombined alleles are indicated flanking the loxP sites (yellow). (B) Representative flow cytometric analysis and sorting plot of Venus-expressing cells in the BM of adult Gata2 Venus (G2V) mice. Gated regions show percentage positive and negative viable cells. (C) Relative levels of Gata2 and Venus mRNA in sorted Venus+ and Venus Gata2V/+ BM cells as determined by qRT-PCR. Gata2 transcripts in Venus+ cells = 0.11337 ± 0.00681 and Venus cells = 0.00012 ± 0.00003 (P = .000076). Venus transcripts in Venus+ cells = 0.06722 ± 0.00799 and Venus cells = 0.00036 ± 0.00010 (P = .00112). Mean ± standard error of the mean (SEM), n = 3. (D) Competitive limiting dilution transplantation strategy used to test the quantity and robustness of Gata2V/V BM HSCs compared with wild type. Percentage of donor cell chimerism in adult irradiated recipients cotransplanted with the same number of wild-type (WT) Ly5.1/5.2 and Gata2 Venus (G2V/V) Ly5.2 BM cells. Varying numbers (1 × 10⁵, 3 × 10⁵, 3 × 10⁶) of BM cells of each genotype were injected, and peripheral blood of recipients was analyzed for donor cell engraftment by FACS at 1 and 4 months after transplantation. n = 2 (5 mice per group). (E) Representative FACS plots demonstrating frequency of Venus expressing cells in E11 AGM, YS, PL, and FL. Gates indicate Venus and Venus+ cell fractions. Percentages represent the frequency of Venus+ cells within the viable cell fraction (Table 1).
Figure 2
Figure 2
Localization of Gata2Venus-expressing cells in embryonic hematopoietic sites. Confocal images of a whole mount immunostained E10.5 Gata2Venus embryo showing (A) Venus (green), (B) CD31 (magenta), and (C) merged expression. Venus-expressing cells are detected in the AGM along the wall of the dorsal aorta (dotted lines), the FL, NT, and OB. (D) Confocal image of a transverse section through the E10.5 AGM. DAPI staining (blue), CD31 (red), and Venus fluorescence (green) revealed Gata2-expressing aortic endothelial and hematopoietic cluster cells and UG and FL cells. Enlarged images of D showing Gata2-expressing cells in (E) AGM (DA, dorsal aorta; UG, urogenital ridges; arrowheads indicate hematopoietic cluster) and (F) FL. Venus (green) and CD34 (red) fluorescence showing endothelial and hematopoietic cluster cells in (G) E9 paired aorta, (H) umbilical artery (UA) at E9, and (I) E11 aorta. Arrowheads indicate hematopoietic cluster. (J-M) Images of E10.5 YS section showing DAPI merged, Venus, CD31, and merged fluorescence. Arrow denotes an endothelial cell expressing Venus and CD31.
Figure 3
Figure 3
Quantitation of functional HSCs and HPCs in G2V embryonic hematopoietic tissues. HSCs in sorted Venus+ and Venus cell fractions of E11 AGM were analyzed by transplantation into irradiated adult recipients. (A) Percentage donor cell chimerism was determined by Venus PCR of peripheral blood DNA at 4 months after transplantation. Each dot represents 1 recipient receiving 1.7 to 6.5 embryo equivalent (ee) of AGM cells. n = 7. **P = .0089. (B-F) Hematopoietic progenitor number per tissue in sorted Venus+ and Venus cell fractions of (B) E9 and E10 AGM, (C) E9 and E10 VA+UA, (D) E9 and E10 YS, (E) E9 and E10 PL, and (F) E10 FL. CFU-C per 1 ee of tissue is shown. Colony types designated by colored bars are CFU-granulocyte, erythroid, monocyte, megakaryocyte (GEMM); CFU-granulocyte, macrophage (GM); CFU-macrophage (M); CFU-granulocyte (G), and burst forming unit-erythroid (BFU-E). SEM of total CFU-C is shown; 2 ee of somite pair–matched tissues were pooled for sorting and yielded 1 ee for colony analysis.
Figure 4
Figure 4
CFU-C numbers and vascular hematopoietic clusters in Gata2−/− embryos. CFU-C numbers per ee found in (A) E9 and E10 AGM, (B) E9 and E10 VA+UA, (C) E9 and E10 YS, and (D) E10 placenta. *P < .05; **P < .01. (E) Quantitation of cKit+ hematopoietic cluster cells in VA+UA of E10 Gata2+/+, Gata2+/−, and Gata2−/− embryos. (F) Representative whole mount images of hematopoietic cluster cells in the VA of E10 Gata2+/+ (30 sp), Gata2+/− (31 sp), and Gata2−/− (30 sp) embryos stained for cKit expression.
Figure 5
Figure 5
Differential expression of signaling pathway modulators in Gata2-dependent and -independent HPCs. (A) Flow cytometric sorting gates for isolation of E10.5 AGM G2V CD31+cKitintVenus (gray) and CD31+cKitintVenus (green) HPCs used for RNA sequence analysis. Gene Expression Omnibus data accession number is GSE76254. (B) Gene enrichment analysis for Ras signaling pathway genes. Bar graphs of fragments per kilobase million (FPKM) values obtained from RNA sequence analysis of CD31+cKitintVenus (gray bar) and CD31+cKitintVenus+ (green bar) AGM cells for (C) Ras pathway and cyclic AMP response element-binding protein (CREB) and CREB-binding protein (CBP) transcription factor genes and (D) Notch pathway genes. (E) Bar graphs of FPKM values obtained from RNA sequence analysis for a selection of chemokine receptor/ligand genes (see Kierdorf et al; these genes were down-/upregulated in YS EMPs compared with adult microglia [AM]). (F) Representative FACS plots demonstrating frequency of EMPs in the Venus+ fraction, as defined as Sca1cKit+CD41+CD16/32+, in YS and AGM of E10 (left) and E11 (right) G2V embryos. Numbers indicate the percentages of gated cells within the parental cell population.
Figure 6
Figure 6
Gata family gene expression in AGM Gata2-dependent and -independent HPCs. (A) qRT-PCR for expression of Gata1, 2, 3, 4, 5, and 6 transcription factors (normalization with Gapdh) in E11 AGM CD31+cKit+Venus+ and CD31+cKit+Venus cells. n = 3. SEM shown with *P = .05 and ***P = .001. (B) Transverse section of WT E10.5 AGM immunostained for CD34 (magenta) and Gata3 (green) showing expression of Gata3 in the aortic endothelial cells and some emerging hematopoietic cells and ventral mesenchymal cells directly under the aorta. (C) Transverse section of G2V E10.5 AGM immunostained for CD34 (magenta), Gata2 (green), and Gata3 (red) showing some overlapping expression of Gata2 and Gata3 in aortic endothelial cells (arrowheads). (D) Transverse consecutive sections of E11 G2V AGM immunostained for CD34 (magenta) and Venus (green) in the top panels and for CD34 (magenta) and Gata4 (red) in the bottom panels. Gata4 expression is observed in some ventral aortic endothelial cells and emerging hematopoietic cells (arrow).
Figure 7
Figure 7
Gata2 is expressed by Venus cells after culture. Schematic diagram showing method and FACS analysis by which Gata2 expression was found in the progeny of sorted Venus HPCs. G2V YS tissue was FACS sorted into Venus and Venus+ fractions. Cells were subsequently seeded in methylcellulose, and colonies were analyzed after 10 days of culture. Colonies were harvested from the dish, cells were washed and stained (with anti-Gr1 and anti-Mac1 antibodies), and Venus, Gr1, and Mac1 expression was analyzed by FACS. FACS plots (top) indicate Venus expression in cells harvested from Venus (left) and Venus+ (right) CFU-C experiments. Note that both FACS analyses indicate Venus expression in both cultures. FACS plots (bottom) show Gr1 and Mac1 expression in Venus and Venus+ populations in both cultures and that cells harvested from the Venus+ culture show a more immature phenotype.

Similar articles

Cited by

References

    1. Wilson NK, Foster SD, Wang X, et al. Combinatorial transcriptional control in blood stem/progenitor cells: genome-wide analysis of ten major transcriptional regulators. Cell Stem Cell. 2010;7(4):532–544. - PubMed
    1. Solaimani Kartalaei P, Yamada-Inagawa T, Vink CS, et al. Whole-transcriptome analysis of endothelial to hematopoietic stem cell transition reveals a requirement for Gpr56 in HSC generation. J Exp Med. 2015;212(1):93–106. - PMC - PubMed
    1. Swiers G, Baumann C, O’Rourke J, et al. Early dynamic fate changes in haemogenic endothelium characterized at the single-cell level. Nat Commun. 2013;4:2924. - PMC - PubMed
    1. Fujiwara Y, Chang AN, Williams AM, Orkin SH. Functional overlap of GATA-1 and GATA-2 in primitive hematopoietic development. Blood. 2004;103(2):583–585. - PubMed
    1. Tsai FY, Keller G, Kuo FC, et al. An early haematopoietic defect in mice lacking the transcription factor GATA-2. Nature. 1994;371(6494):221–226. - PubMed

Publication types

MeSH terms