

BEYOND TEXT: USING ARRAYS TO REPRESENT AND ANALYZE ETHNOGRAPHIC DATA
- PMID: 26834296
- PMCID: PMC4730903
- DOI: 10.1177/0081175015578740
BEYOND TEXT: USING ARRAYS TO REPRESENT AND ANALYZE ETHNOGRAPHIC DATA
Abstract
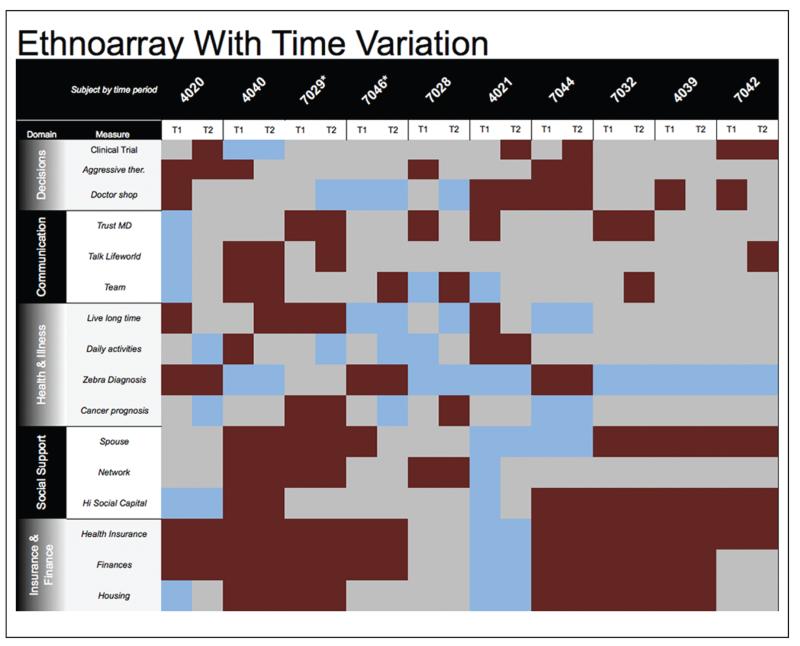
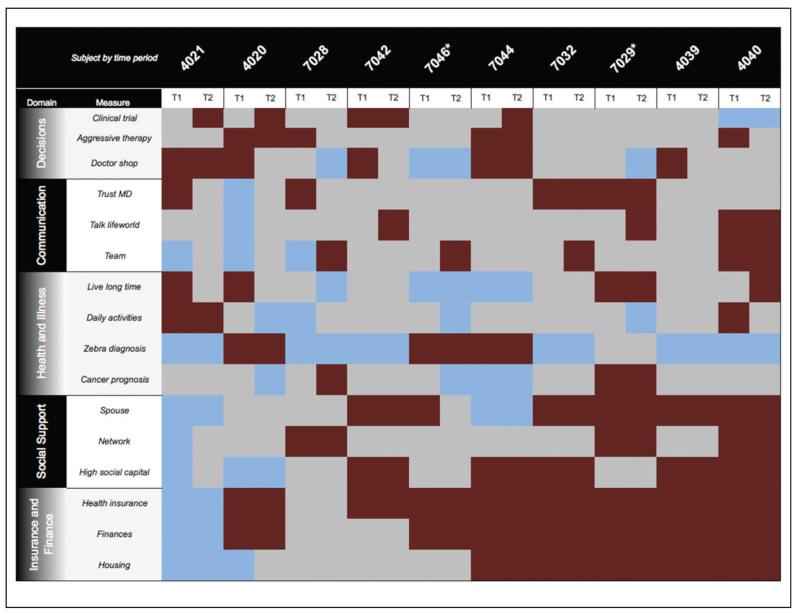
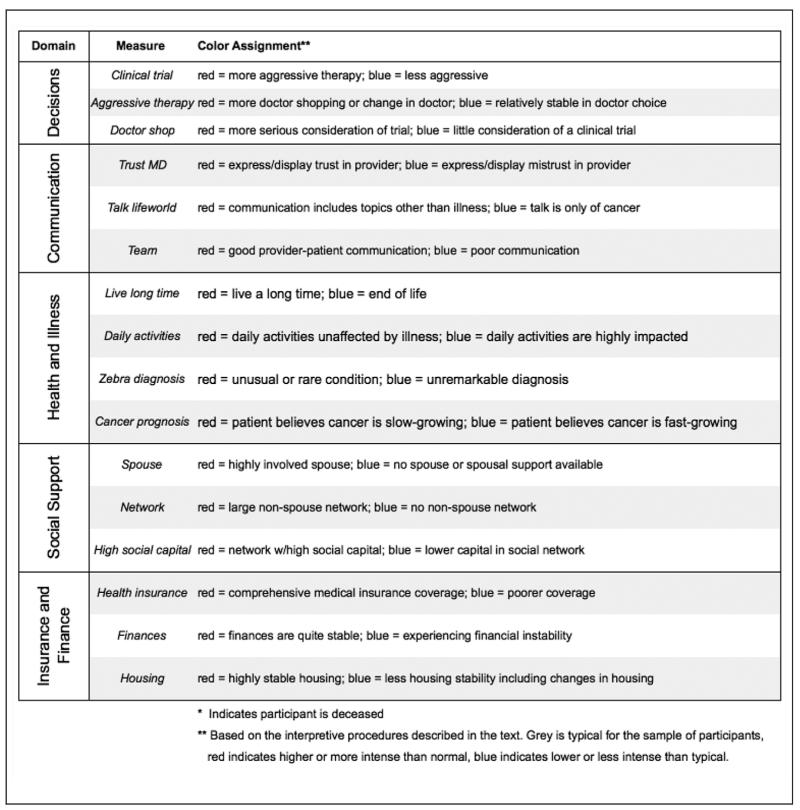
Recent methodological debates in sociology have focused on how data and analyses might be made more open and accessible, how the process of theorizing and knowledge production might be made more explicit, and how developing means of visualization can help address these issues. In ethnography, where scholars from various traditions do not necessarily share basic epistemological assumptions about the research enterprise with either their quantitative colleagues or one another, these issues are particularly complex. Nevertheless, ethnographers working within the field of sociology face a set of common pragmatic challenges related to managing, analyzing, and presenting the rich context-dependent data generated during fieldwork. Inspired by both ongoing discussions about how sociological research might be made more transparent, as well as innovations in other data-centered fields, the authors developed an interactive visual approach that provides tools for addressing these shared pragmatic challenges. They label the approach "ethnoarray" analysis. This article introduces this approach and explains how it can help scholars address widely shared logistical and technical complexities, while remaining sensitive to both ethnography's epistemic diversity and its practitioners shared commitment to depth, context, and interpretation. The authors use data from an ethnographic study of serious illness to construct a model of an ethnoarray and explain how such an array might be linked to data repositories to facilitate new forms of analysis, interpretation, and sharing within scholarly and lay communities. They conclude by discussing some potential implications of the ethnoarray and related approaches for the scope, practice, and forms of ethnography.
Keywords: computational ethnography; computational methods; data analysis; ethnography; mixed methods; representation; transparency; visualization.
Figures

References
-
- Abbott Andrew, Alexandra Hrycak. Measuring Resemblance in Sequence Data: An Optimal Matching Analysis of Musicians’ Careers. American Journal of Sociology. 1990;96(1):144–85.
-
- Abramson Corey M. The End Game: How Inequality Shapes Our Final Years. Harvard University Press; Cambridge, MA: 2015.
-
- Anderson Elijah. A Place on the Corner. University of Chicago Press; Chicago: 1978.
-
- Becker Howard. Problems of Inference and Proof in Participant Observation. American Sociological Review. 1958;23(6):652–60.
-
- Becker Howard S. How to Find Out How to Do Qualitative Research. International Journal of Communication. 2009;9:545–53.
Grants and funding
LinkOut - more resources
Full Text Sources
Other Literature Sources