

Top-Down Control of Visual Alpha Oscillations: Sources of Control Signals and Their Mechanisms of Action
- PMID: 26834601
- PMCID: PMC4718979
- DOI: 10.3389/fnhum.2016.00015
Top-Down Control of Visual Alpha Oscillations: Sources of Control Signals and Their Mechanisms of Action
Abstract
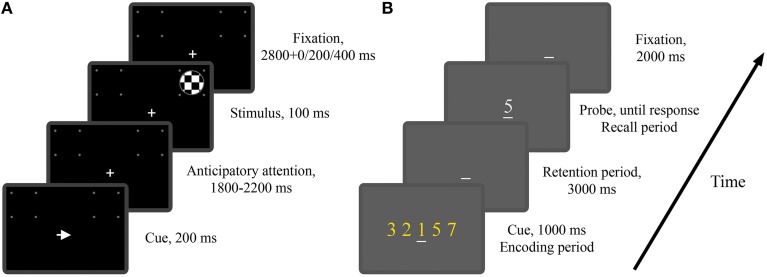
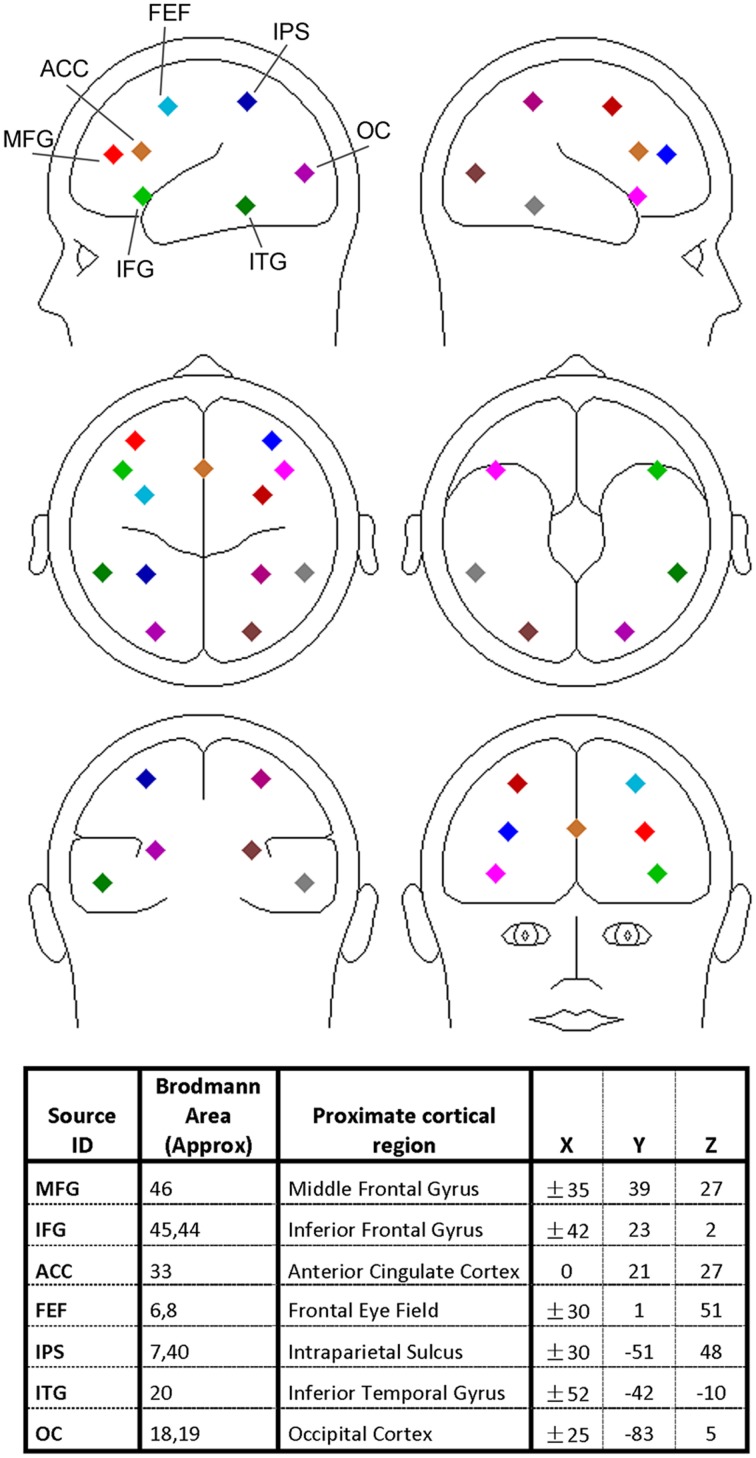
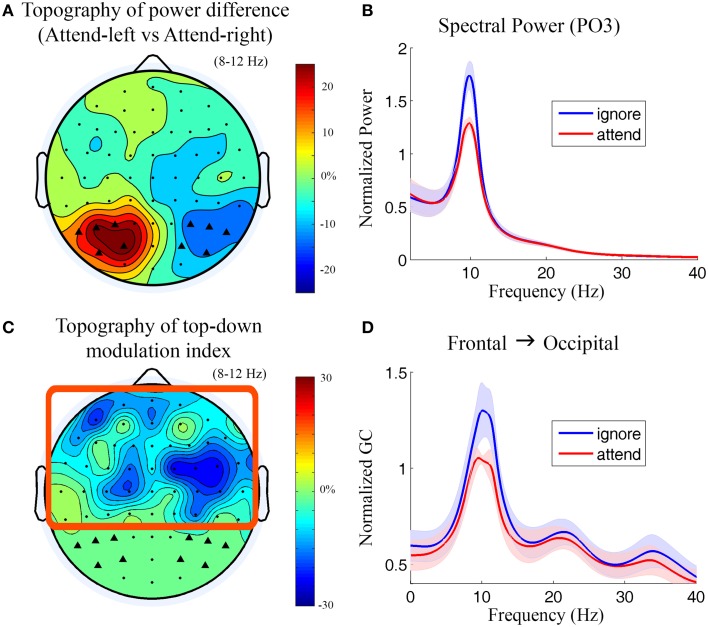
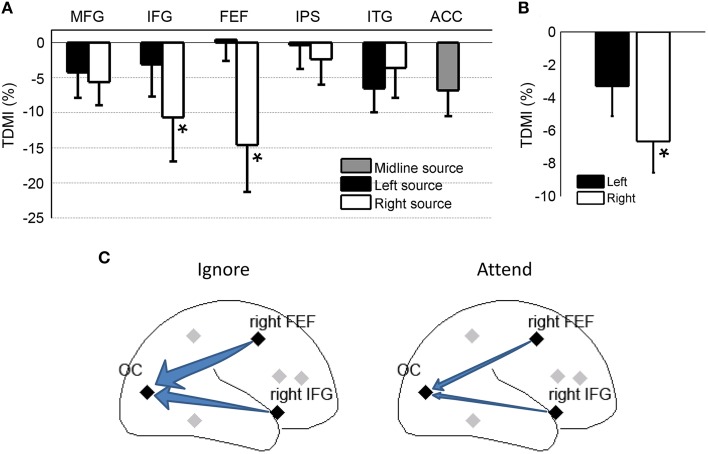
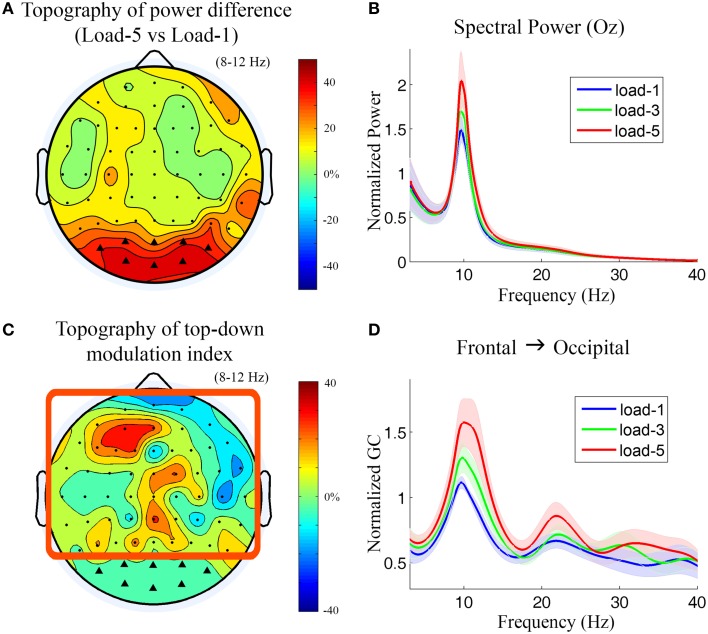
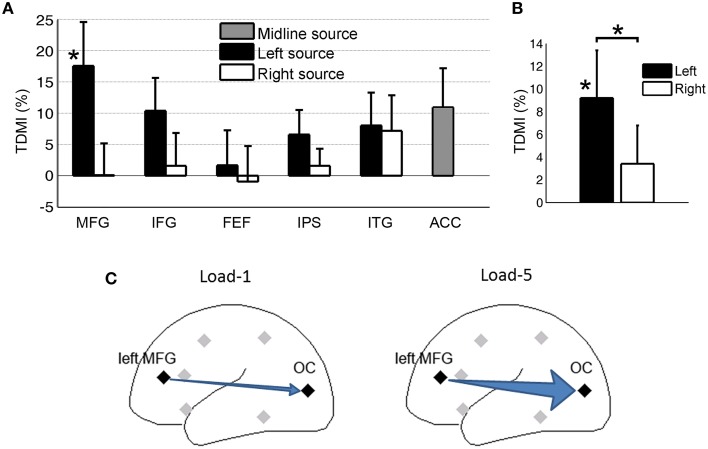
Alpha oscillations (8-12 Hz) are thought to inversely correlate with cortical excitability. Goal-oriented modulation of alpha has been studied extensively. In visual spatial attention, alpha over the region of visual cortex corresponding to the attended location decreases, signifying increased excitability to facilitate the processing of impending stimuli. In contrast, in retention of verbal working memory, alpha over visual cortex increases, signifying decreased excitability to gate out stimulus input to protect the information held online from sensory interference. According to the prevailing model, this goal-oriented biasing of sensory cortex is effected by top-down control signals from frontal and parietal cortices. The present study tests and substantiates this hypothesis by (a) identifying the signals that mediate the top-down biasing influence, (b) examining whether the cortical areas issuing these signals are task-specific or task-independent, and (c) establishing the possible mechanism of the biasing action. High-density human EEG data were recorded in two experimental paradigms: a trial-by-trial cued visual spatial attention task and a modified Sternberg working memory task. Applying Granger causality to both sensor-level and source-level data we report the following findings. In covert visual spatial attention, the regions exerting top-down control over visual activity are lateralized to the right hemisphere, with the dipoles located at the right frontal eye field (FEF) and the right inferior frontal gyrus (IFG) being the main sources of top-down influences. During retention of verbal working memory, the regions exerting top-down control over visual activity are lateralized to the left hemisphere, with the dipoles located at the left middle frontal gyrus (MFG) being the main source of top-down influences. In both experiments, top-down influences are mediated by alpha oscillations, and the biasing effect is likely achieved via an inhibition-disinhibition mechanism.
Keywords: EEG; alpha oscillaitons; granger causality; top-down control; visual spatial attention; working memory.
Figures
Similar articles
-
Top-down Modulation of Neural Activity in Anticipatory Visual Attention: Control Mechanisms Revealed by Simultaneous EEG-fMRI.Cereb Cortex. 2016 Feb;26(2):517-29. doi: 10.1093/cercor/bhu204. Epub 2014 Sep 9. Cereb Cortex. 2016. PMID: 25205663 Free PMC article.
-
Frontal eye fields control attentional modulation of alpha and gamma oscillations in contralateral occipitoparietal cortex.J Neurosci. 2015 Jan 28;35(4):1638-47. doi: 10.1523/JNEUROSCI.3116-14.2015. J Neurosci. 2015. PMID: 25632139 Free PMC article.
-
Hemispheric lateralization in top-down attention during spatial relation processing: a Granger causal model approach.Eur J Neurosci. 2015 Apr;41(7):914-24. doi: 10.1111/ejn.12846. Epub 2015 Feb 20. Eur J Neurosci. 2015. PMID: 25704649
-
Mechanisms of visual attention in the human cortex.Annu Rev Neurosci. 2000;23:315-41. doi: 10.1146/annurev.neuro.23.1.315. Annu Rev Neurosci. 2000. PMID: 10845067 Review.
-
Structure, function and connectivity fingerprints of the frontal eye field versus the inferior frontal junction: A comprehensive comparison.Eur J Neurosci. 2021 Aug;54(4):5462-5506. doi: 10.1111/ejn.15393. Epub 2021 Aug 4. Eur J Neurosci. 2021. PMID: 34273134 Free PMC article. Review.
Cited by
-
Closed-Loop Neurofeedback of α Synchrony during Goal-Directed Attention.J Neurosci. 2021 Jun 30;41(26):5699-5710. doi: 10.1523/JNEUROSCI.3235-20.2021. Epub 2021 May 21. J Neurosci. 2021. PMID: 34021043 Free PMC article. Clinical Trial.
-
Theta Oscillations Index Frontal Decision-Making and Mediate Reciprocal Frontal-Parietal Interactions in Willed Attention.Cereb Cortex. 2019 Jul 5;29(7):2832-2843. doi: 10.1093/cercor/bhy149. Cereb Cortex. 2019. PMID: 29931088 Free PMC article.
-
Alpha desynchronization/synchronization during working memory testing is compromised in acute mild traumatic brain injury (mTBI).PLoS One. 2018 Feb 14;13(2):e0188101. doi: 10.1371/journal.pone.0188101. eCollection 2018. PLoS One. 2018. PMID: 29444081 Free PMC article.
-
Research on Differential Brain Networks before and after WM Training under Different Frequency Band Oscillations.Neural Plast. 2021 Mar 20;2021:6628021. doi: 10.1155/2021/6628021. eCollection 2021. Neural Plast. 2021. PMID: 33824657 Free PMC article.
-
The Neural Correlates of Chronic Symptoms of Vertigo Proneness in Humans.PLoS One. 2016 Apr 18;11(4):e0152309. doi: 10.1371/journal.pone.0152309. eCollection 2016. PLoS One. 2016. PMID: 27089185 Free PMC article.
References
Grants and funding
LinkOut - more resources
Full Text Sources
Other Literature Sources