

An Assessment of Six Muscle Spindle Models for Predicting Sensory Information during Human Wrist Movements
- PMID: 26834618
- PMCID: PMC4712307
- DOI: 10.3389/fncom.2015.00154
An Assessment of Six Muscle Spindle Models for Predicting Sensory Information during Human Wrist Movements
Abstract
Background: The muscle spindle is an important sensory organ for proprioceptive information, yet there have been few attempts to use Shannon information theory to quantify the capacity of human muscle spindles to encode sensory input.
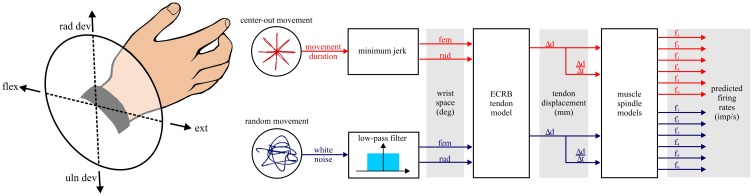
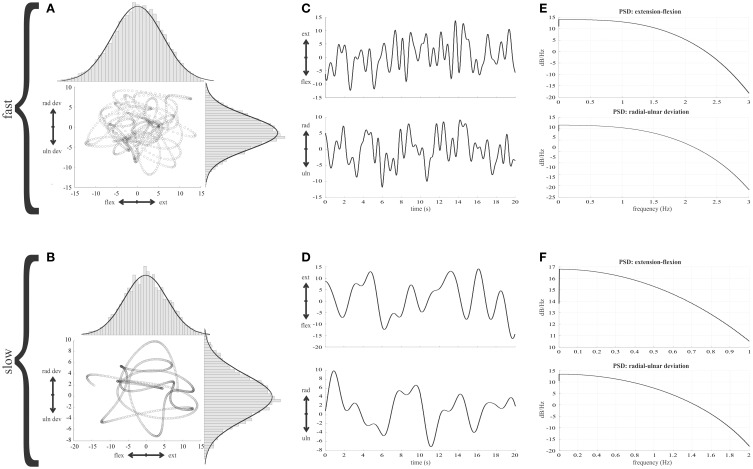
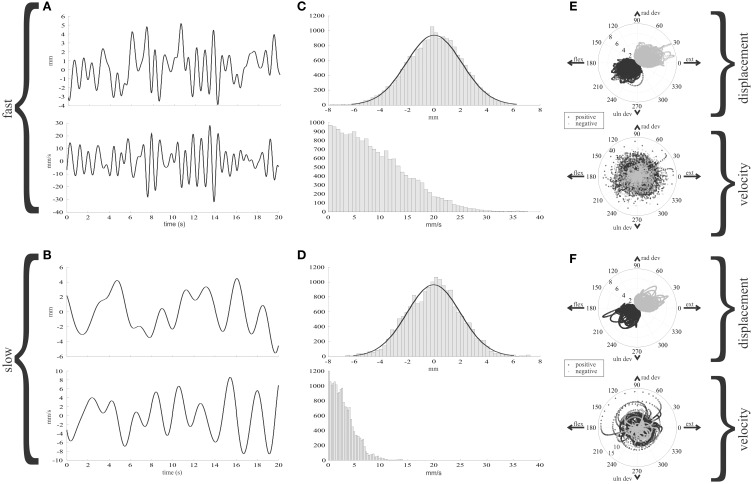
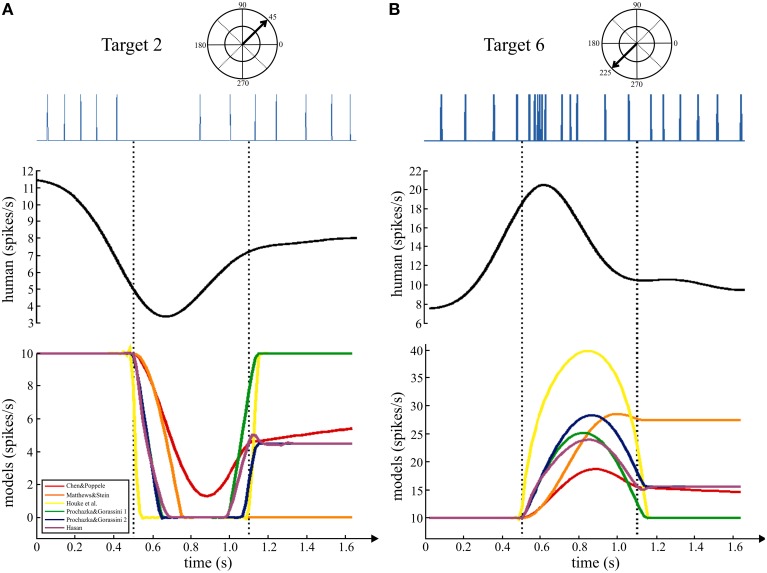
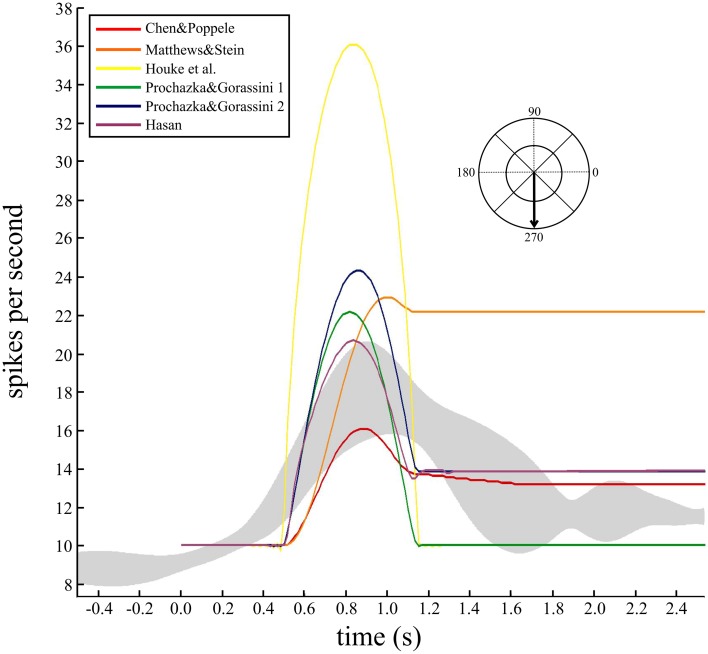
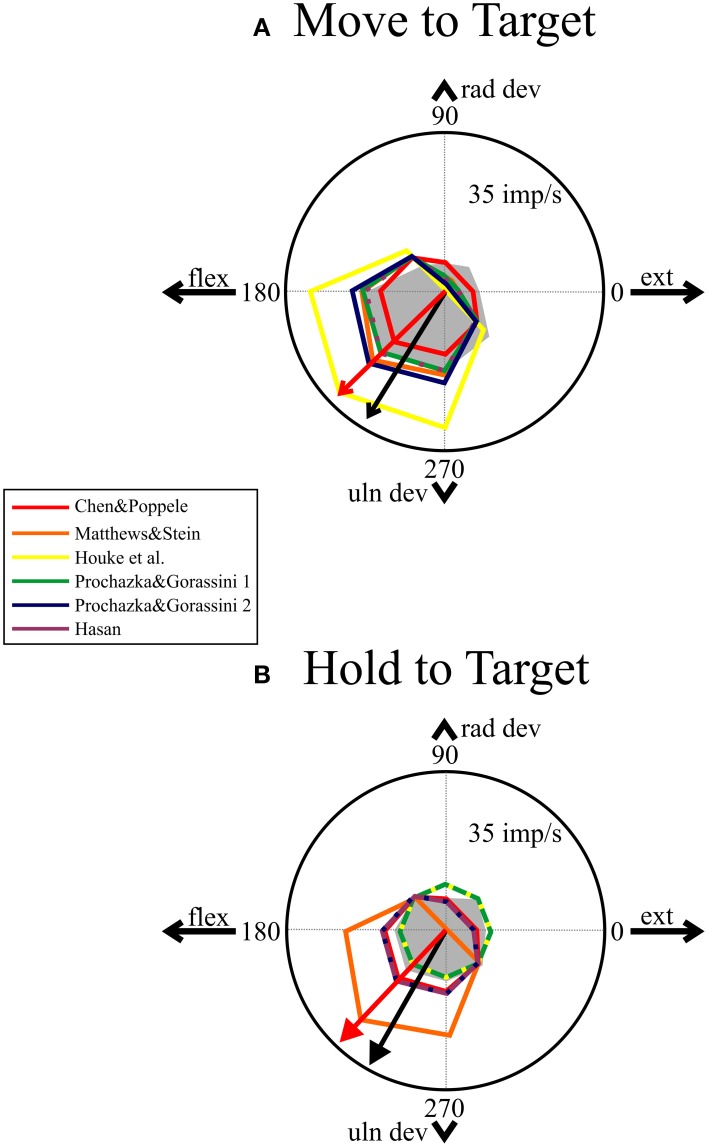
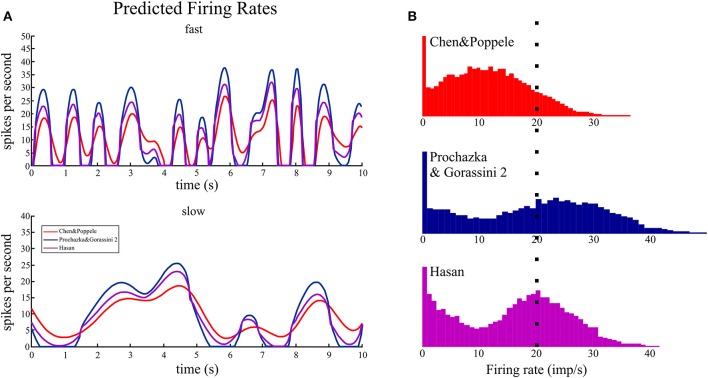
Methods: Computer simulations linked kinematics, to biomechanics, to six muscle spindle models that generated predictions of firing rate. The predicted firing rates were compared to firing rates of human muscle spindles recorded during a step-tracking (center-out) task to validate their use. The models were then used to predict firing rates during random movements with statistical properties matched to the ergonomics of human wrist movements. The data were analyzed for entropy and mutual information.
Results: Three of the six models produced predictions that approximated the firing rate of human spindles during the step-tracking task. For simulated random movements these models predicted mean rates of 16.0 ± 4.1 imp/s (mean ± SD), peak firing rates <50 imp/s and zero firing rate during an average of 25% of the movement. The average entropy of the neural response was 4.1 ± 0.3 bits and is an estimate of the maximum information that could be carried by muscles spindles during ecologically valid movements. The information about tendon displacement preserved in the neural response was 0.10 ± 0.05 bits per symbol; whereas 1.25 ± 0.30 bits per symbol of velocity input were preserved in the neural response of the spindle models.
Conclusions: Muscle spindle models, originally based on cat experiments, have predictive value for modeling responses of human muscle spindles with minimal parameter optimization. These models predict more than 10-fold more velocity over length information encoding during ecologically valid movements. These results establish theoretical parameters for developing neuroprostheses for proprioceptive function.
Keywords: Ia afferent; entropy; proprioception; sensorimotor control; spike train.
Figures
Similar articles
-
"Proprioceptive signature" of cursive writing in humans: a multi-population coding.Exp Brain Res. 2004 Aug;157(3):359-68. doi: 10.1007/s00221-004-1853-x. Epub 2004 Mar 9. Exp Brain Res. 2004. PMID: 15007582
-
Ensemble firing of muscle afferents recorded during normal locomotion in cats.J Physiol. 1998 Feb 15;507 ( Pt 1)(Pt 1):293-304. doi: 10.1111/j.1469-7793.1998.293bu.x. J Physiol. 1998. PMID: 9490855 Free PMC article.
-
Discharges in human muscle spindle afferents during a key-pressing task.J Physiol. 2008 Nov 15;586(22):5455-70. doi: 10.1113/jphysiol.2008.160036. Epub 2008 Sep 18. J Physiol. 2008. PMID: 18801840 Free PMC article.
-
Representation of wrist joint kinematics by the ensemble of muscle spindles from synergistic muscles.J Neurophysiol. 1998 May;79(5):2265-76. doi: 10.1152/jn.1998.79.5.2265. J Neurophysiol. 1998. PMID: 9582203 Clinical Trial.
-
Biophysical model of muscle spindle encoding.Exp Physiol. 2024 Jan;109(1):55-65. doi: 10.1113/EP091099. Epub 2023 Mar 26. Exp Physiol. 2024. PMID: 36966478 Free PMC article. Review.
Cited by
-
A leg to stand on: computational models of proprioception.Curr Opin Physiol. 2021 Aug;22:100426. doi: 10.1016/j.cophys.2021.03.001. Epub 2021 Mar 19. Curr Opin Physiol. 2021. PMID: 34595361 Free PMC article.
-
Role and modulation of various spinal pathways for human upper limb control in different gravity conditions.PLoS Comput Biol. 2025 Jan 6;21(1):e1012069. doi: 10.1371/journal.pcbi.1012069. eCollection 2025 Jan. PLoS Comput Biol. 2025. PMID: 39761279 Free PMC article.
-
The spinal cord facilitates cerebellar upper limb motor learning and control; inputs from neuromusculoskeletal simulation.PLoS Comput Biol. 2024 Jan 2;20(1):e1011008. doi: 10.1371/journal.pcbi.1011008. eCollection 2024 Jan. PLoS Comput Biol. 2024. PMID: 38166093 Free PMC article.
-
Symbiotic electroneural and musculoskeletal framework to encode proprioception via neurostimulation: ProprioStim.iScience. 2023 Feb 21;26(3):106248. doi: 10.1016/j.isci.2023.106248. eCollection 2023 Mar 17. iScience. 2023. PMID: 36923003 Free PMC article.
-
Computational evidence for nonlinear feedforward modulation of fusimotor drive to antagonistic co-contracting muscles.Sci Rep. 2020 Jun 30;10(1):10625. doi: 10.1038/s41598-020-67403-w. Sci Rep. 2020. PMID: 32606297 Free PMC article.
References
-
- Batschelet E. (1981). Circular Statistics in Biology. London; New York, NY: Academic Press.
-
- Chen W. J., Poppele R. E. (1978). Small-signal analysis of response of mammalian muscle spindles with fusimotor stimulation and a comparison with large-signal responses. J. Neurophysiol. 41, 15–27. - PubMed
LinkOut - more resources
Full Text Sources
Other Literature Sources
Miscellaneous