

Phylogenetic Analyses of Shigella and Enteroinvasive Escherichia coli for the Identification of Molecular Epidemiological Markers: Whole-Genome Comparative Analysis Does Not Support Distinct Genera Designation
- PMID: 26834722
- PMCID: PMC4718091
- DOI: 10.3389/fmicb.2015.01573
Phylogenetic Analyses of Shigella and Enteroinvasive Escherichia coli for the Identification of Molecular Epidemiological Markers: Whole-Genome Comparative Analysis Does Not Support Distinct Genera Designation
Erratum in
-
Corrigendum: Phylogenetic Analyses of Shigella and Enteroinvasive Escherichia coli for the Identification of Molecular Epidemiological Markers: Whole-Genome Comparative Analysis Does Not Support Distinct Genera Designation.Front Microbiol. 2018 Jan 9;8:2598. doi: 10.3389/fmicb.2017.02598. eCollection 2017. Front Microbiol. 2018. PMID: 29371861 Free PMC article.
Abstract
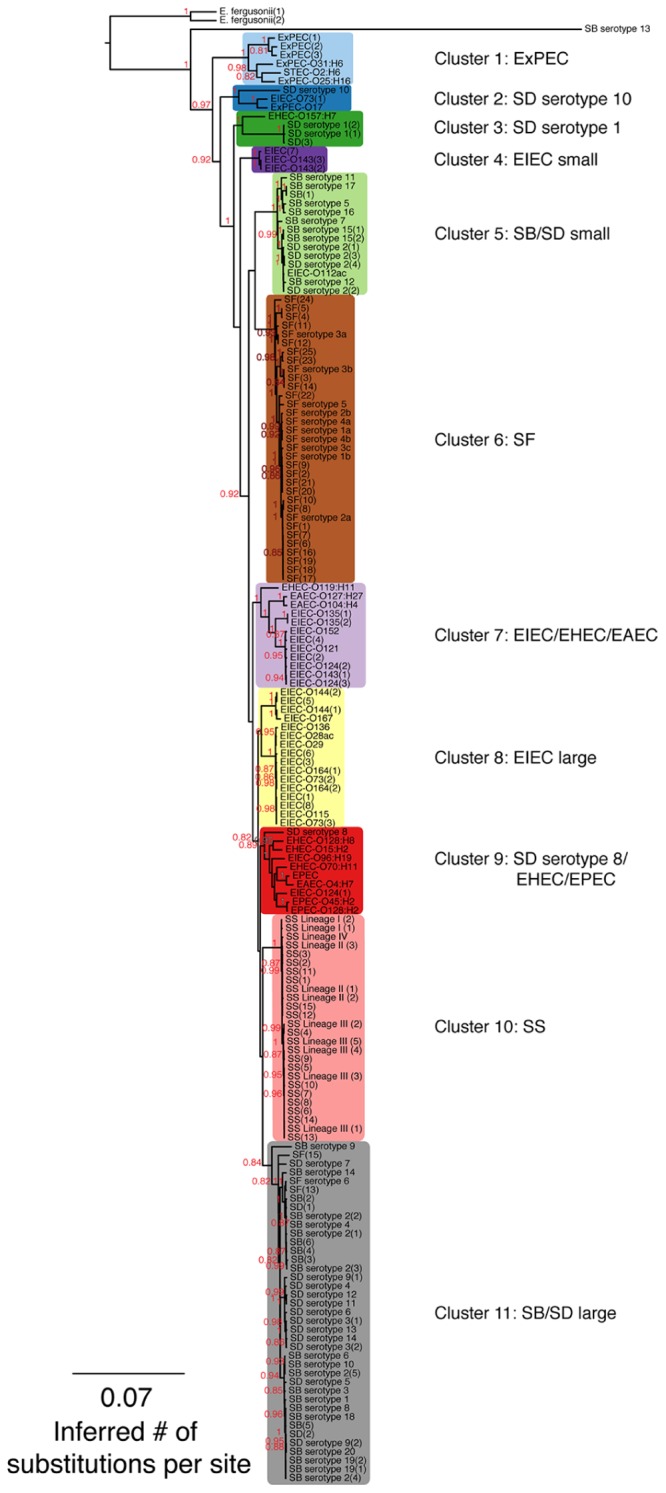
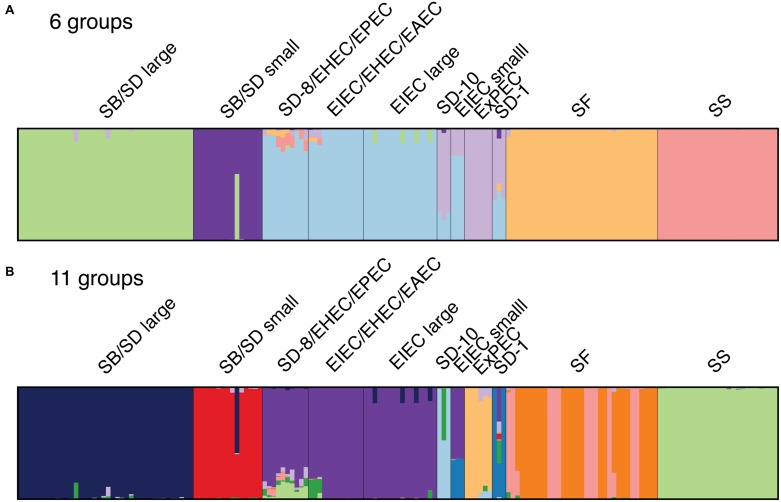
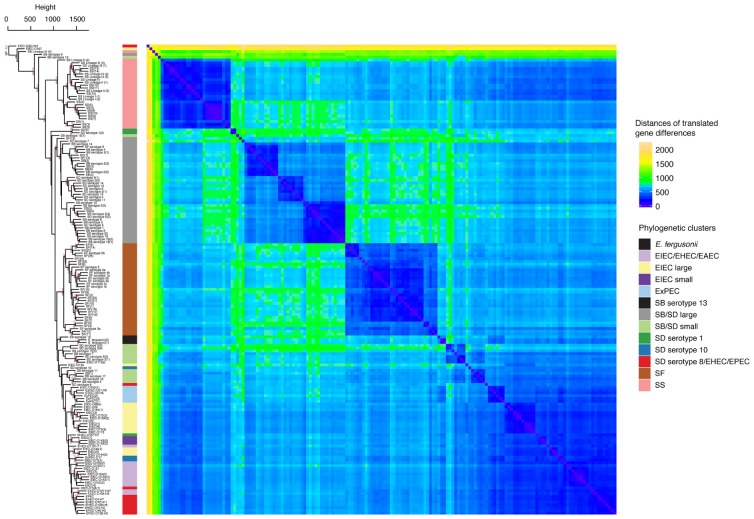
As a leading cause of bacterial dysentery, Shigella represents a significant threat to public health and food safety. Related, but often overlooked, enteroinvasive Escherichia coli (EIEC) can also cause dysentery. Current typing methods have limited ability to identify and differentiate between these pathogens despite the need for rapid and accurate identification of pathogens for clinical treatment and outbreak response. We present a comprehensive phylogeny of Shigella and EIEC using whole genome sequencing of 169 samples, constituting unparalleled strain diversity, and observe a lack of monophyly between Shigella and EIEC and among Shigella taxonomic groups. The evolutionary relationships in the phylogeny are supported by analyses of population structure and hierarchical clustering patterns of translated gene homolog abundance. Lastly, we identified a panel of 404 single nucleotide polymorphism (SNP) markers specific to each phylogenetic cluster for more accurate identification of Shigella and EIEC. Our findings show that Shigella and EIEC are not distinct evolutionary groups within the E. coli genus and, thus, EIEC as a group is not the ancestor to Shigella. The multiple analyses presented provide evidence for reconsidering the taxonomic placement of Shigella. The SNP markers offer more discriminatory power to molecular epidemiological typing methods involving these bacterial pathogens.
Keywords: Shigella; classification; enteroinvasive E. coli (EIEC); epidemiological markers; phylogeny; whole genome sequencing.
Figures
References
-
- Center for Food Safety and Applied Nutrition (2001). Laboratory Methods - Bacteriological Analytical Manual (BAM). Available at: http://www.fda.gov/Food/FoodScienceResearch/LaboratoryMethods/ucm2006949...
LinkOut - more resources
Full Text Sources
Other Literature Sources
Research Materials