. 2016 Jan 25:7:9.
doi: 10.3389/fimmu.2016.00009. eCollection 2016.

Tolerogenic IDO(+) Dendritic Cells Are Induced by PD-1-Expressing Mast Cells

Affiliations

Tolerogenic IDO(+) Dendritic Cells Are Induced by PD-1-Expressing Mast Cells

Cecilia Pessoa Rodrigues et al. Front Immunol. .

Abstract

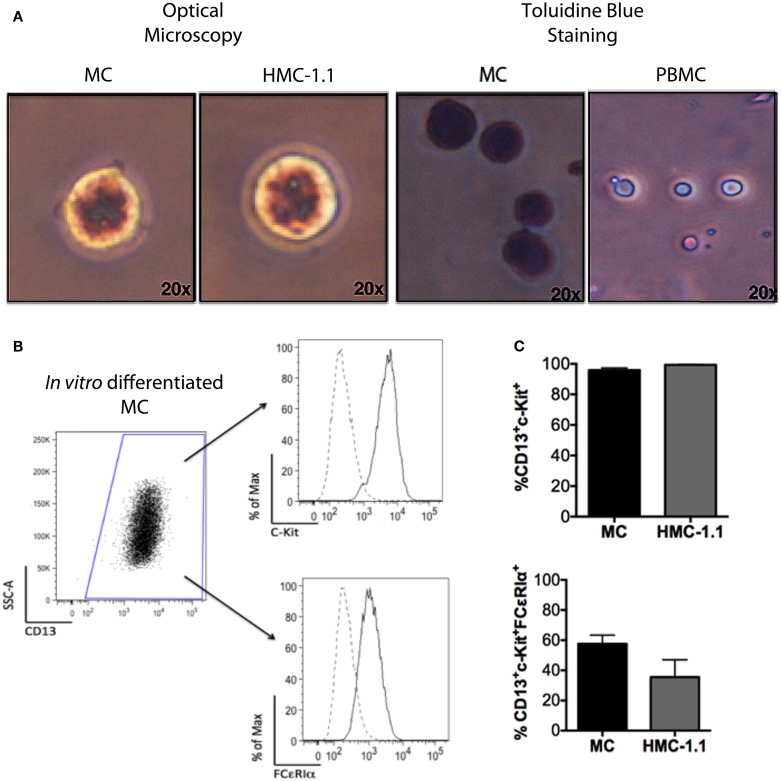
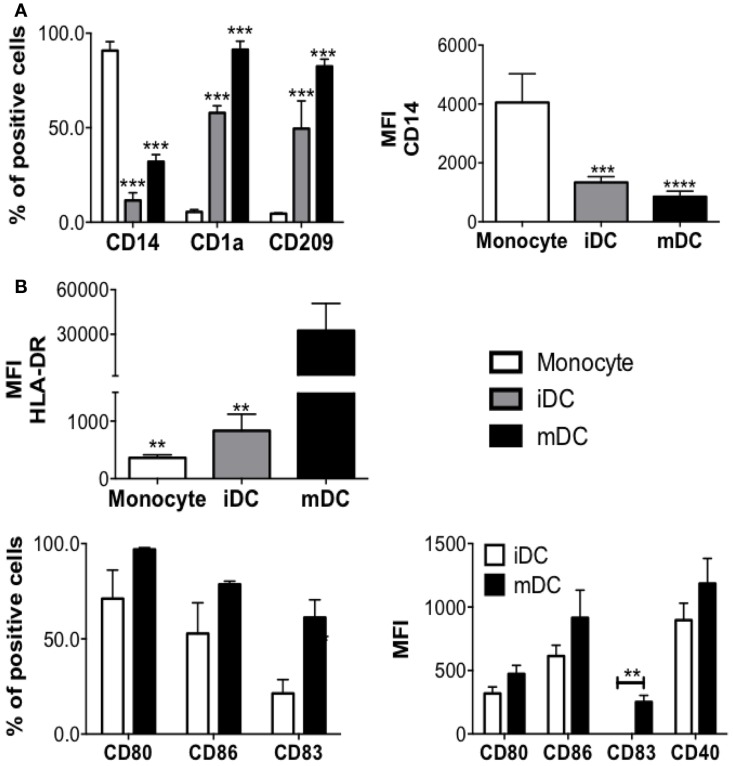
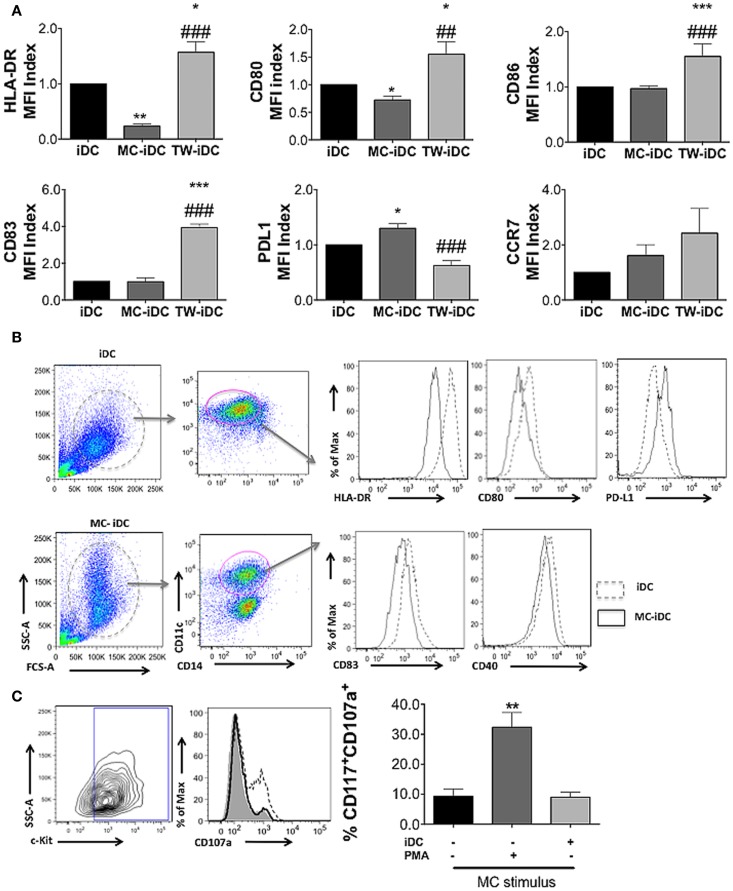
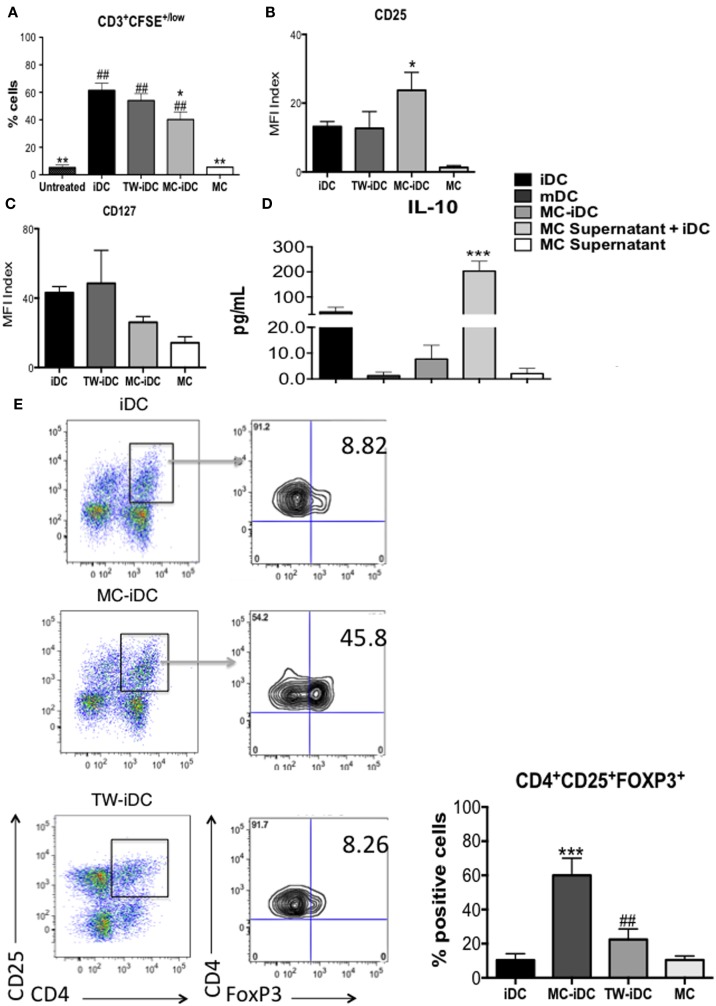
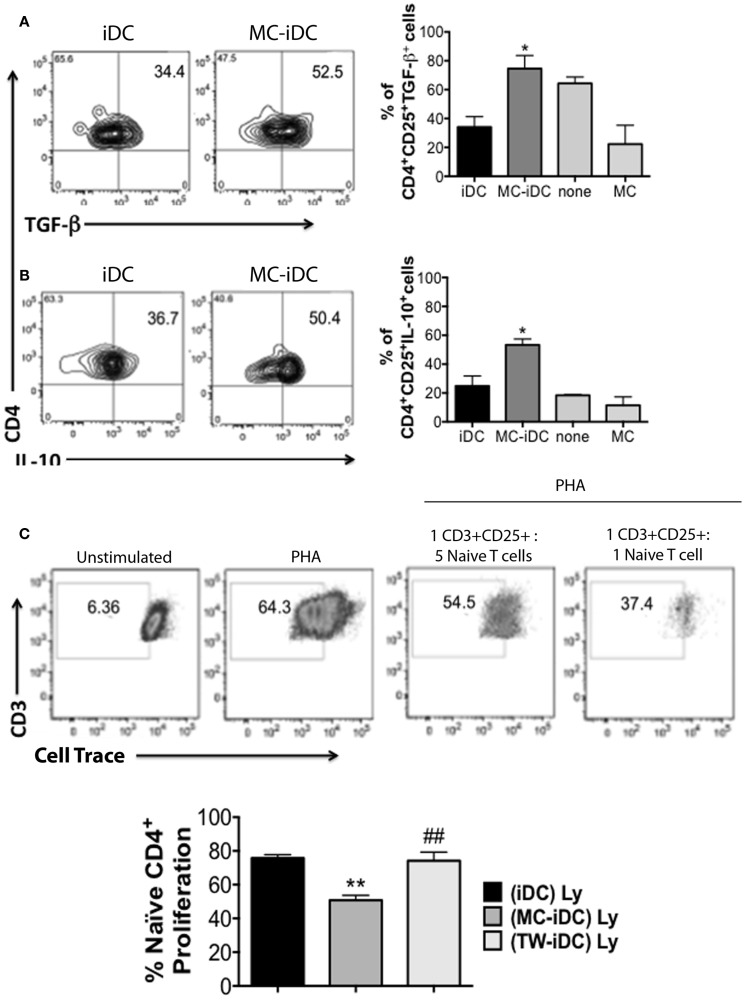
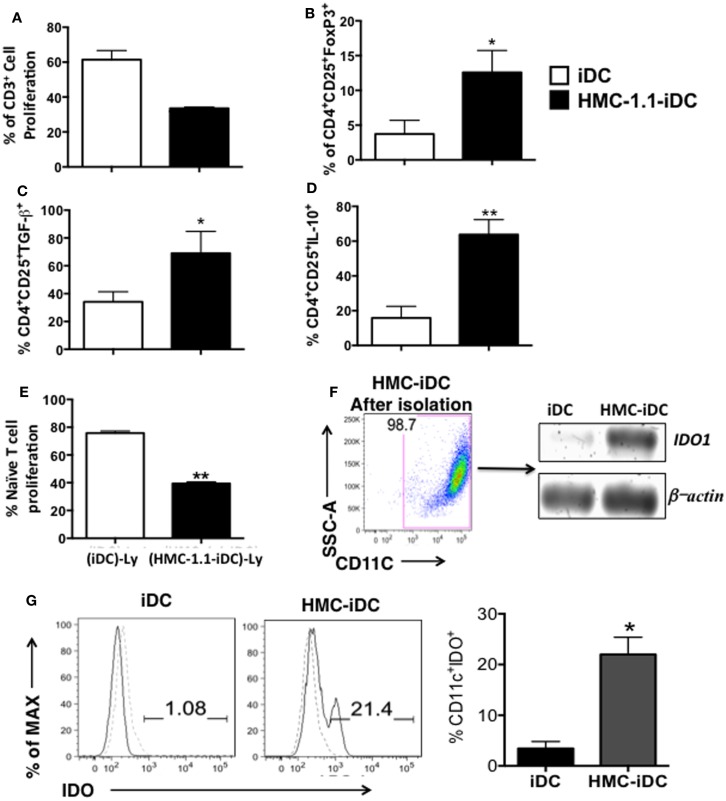
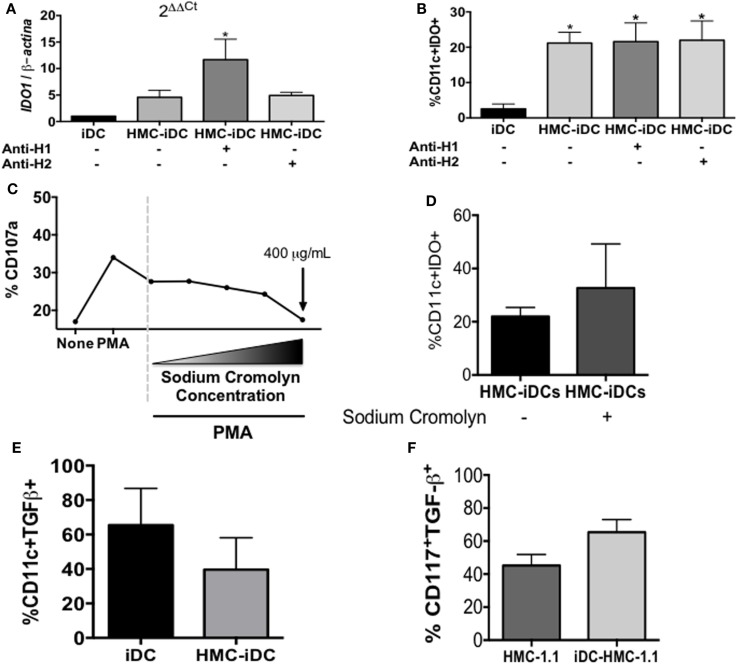
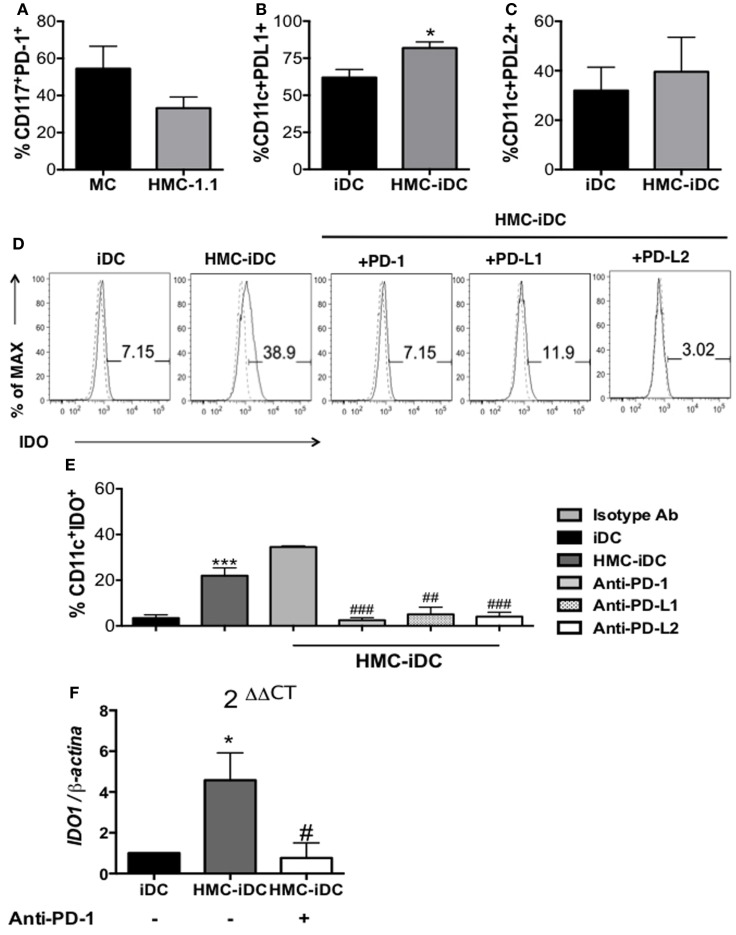
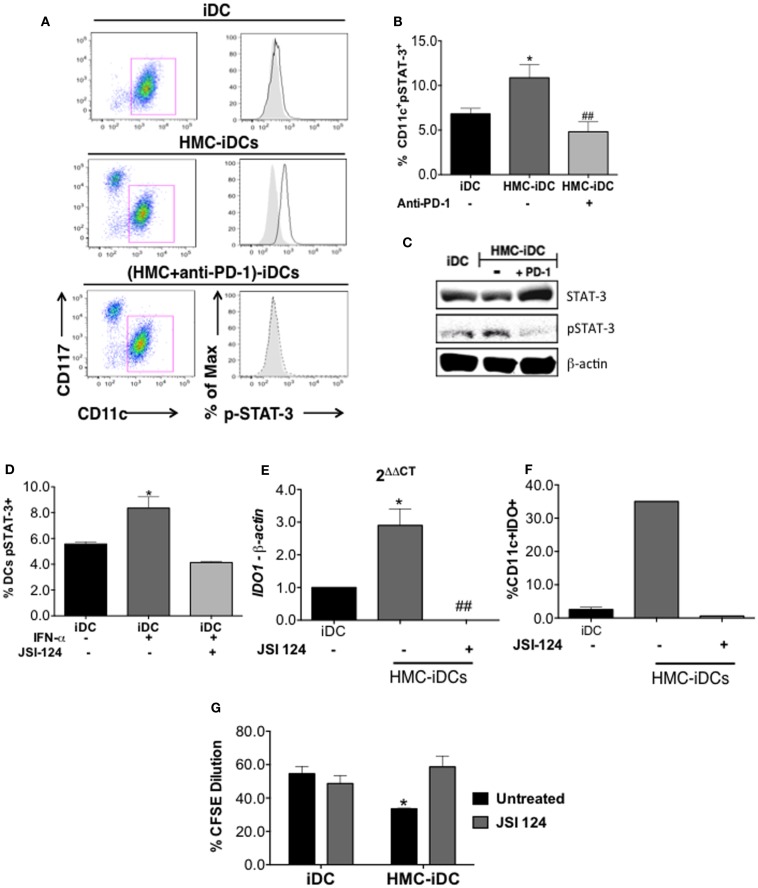
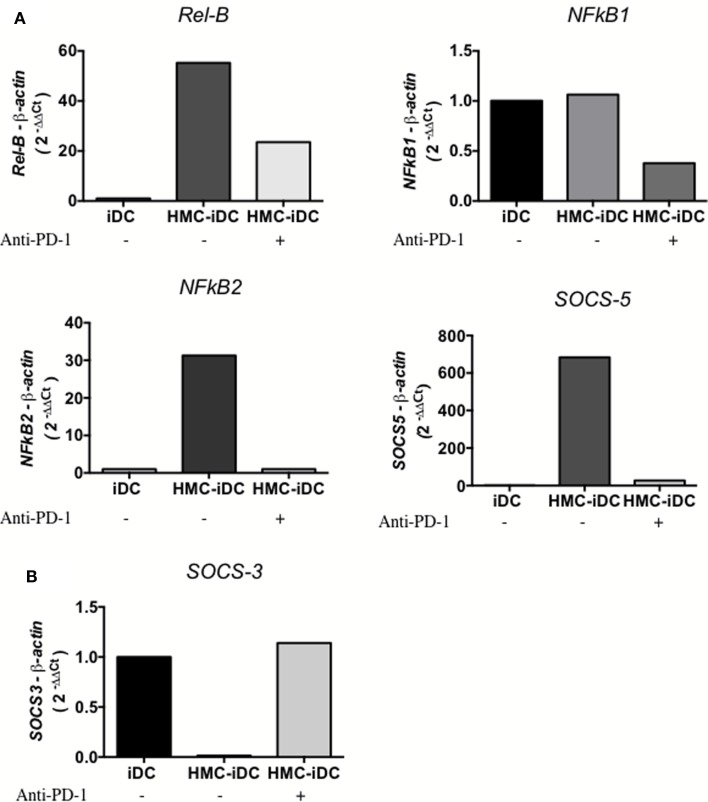
Mast cells (MCs) are tissue resident cells, rich in inflammatory mediators, involved in allergic reactions, and with an increasingly recognized role in immunomodulation. Dendritic cells (DCs), on the other hand, are central to the determination of immune response patterns, being highly efficient antigen-presenting cells that respond promptly to changes in their microenvironment. Here, we show that direct cell contact between immature monocyte-derived DCs (iDCs) and MC bends DCs toward tolerance induction. DCs that had direct contact with MC (MC-iDC) decreased HLA-DR but increased PD-L1 expression and stimulated regulatory T lymphocytes, which expresses FoxP3(+), secrete TGF-β and IL-10, and suppress the proliferation of mitogen-stimulated naïve T lymphocytes. Furthermore, MC-iDC expressed higher levels of indoleamine-2,3-deoxigenase (IDO), a phenomenon that was blocked by treatment of MC with anti-PD-1 or by the treatment of DCs with anti-PD-L1 or anti-PD-L2, but not by blocking of H1 and H2 histamine receptors on DCs. Contact with MC also increased phosphorylated STAT-3 levels in iDCs. When a STAT-3 inhibitor, JSI-124, was added to the DCs before contact with MC, the MC-iDC recovered their ability to induce allogeneic T cell proliferation and did not increase their IDO expression.

Keywords: IDO; STAT-3; Tregs; mast cells; tolerogenic DCs.


Figures

Figure 1
Figure 1
Phenotype of in vitro-differentiated MC and of the HMC-1.1 cell line. Adult peripheral CD34+ cells were isolated using immunomagnetic beads and induced to differentiate into MC, as described. (A) Morphology of the in vitro cells after 8 weeks, showing toluidine blue staining, similar to that of the human mastocytoma line HMC-1.1. (B) Representative flow cytometry analysis showing CD13+ cells and within those, c-kit+, and FCϵRIα+ cells (dotted lines represent unstained cells). (C) Comparison of the immunophenotype of in vitro-differentiated MC (n = 10) and cells of the HMC-1.1 line.
Figure 2
Figure 2
DC differentiation and maturation. (A) Phenotype changes during DC differentiation (n = 4), ***p < 0.001, **p < 0.01 vs. monocytes; (B) DCs phenotype changes after DCs maturation induced by TNF-alpha treatment for 48 h (n = 4), *p < 0.05 vs. mDCs.
Figure 3
Figure 3
DC phenotype after coculture with MC. (A) Phenotype of DCs (CD14CD11c+ cells) phenotype cultured alone (iDCs), cocultured with MC (MC-iDC), or exposed to MC supernatant in a transwell culture system (TW-iDC); cells were labeled with fluorescent antibodies, the median fluorescence intensity (MFI) was determined for each marker and the MFI index calculated by the formula: MFI of the experimental group/MFI of control iDCs (of each independent experiment, n = 4); *p < 0.05, **/##p < 0.01, ***/###p < 0.001, * compared to iDC and # compared to MC-iDC. (B) Representative experiment showing the expression of different markers (dotted lines represent iDC and continuous lines, MC-iDC). (C) Representative and cumulative data on CD107a expression by MC (CD117+ cells) cultured alone (continuous line), in the presence of iDCs (shaded area) or stimulated by PMA (100 nM – dotted line), n = 3; **p < 0.01 vs. untreated MC and vs. MC-iDC. All comparisons between groups were performed by one-way ANOVA followed by Tukey.
Figure 4
Figure 4
Induction of Tregs by MC-iDC. (A) Immunomagnetic beads-selected CD3+ T cells were labeled with CFSE, stimulated by different cells (iDC n = 7; MC-iDC n = 8; TW-iDC n = 4; MC n = 3), at a 10:1 ratio and their proliferation evaluated by dilution of the dye; comparisons were performed by one-way ANOVA followed by the Tukey’s multiple comparisons test, (*) comparisons to iDC and (#) comparisons to untreated lymphocytes, */#p < 0.05, **/##p < 0.01. (B) CD25 expression of T cells stimulated by the various cell populations (iDCs, MC-iDC, TW-iDC, or MC alone); the CD25 expression index was calculated by the formula: (% of positive cells × MFI of positive cells)/1000; n = 6. (C) The same as (B), but for CD127 expression; n = 3. (D) Cumulative data on the presence of IL-10 in the supernatant of iDC, DCs treated with TNF-α (mDC), cultured in direct contact (MC-iDC) or with 20% MC supernatant (MC supernatant + iDC) (n = 3); MC supernatant alone was used as a control; results assessed by the CBA assay; comparison performed by ANOVA followed by Tukey, ***p < 0.01. (E) Representative and cumulative data on FoxP3 expression by CD3+CD4+CD25+ T cells after stimulation with iDCs (n = 6), MC-iDC (n = 5), TW-iDCs (n = 5), or MC (n = 7); ***p < 0.001, compared to iDC, ##p < 0.01, compared to MC-iDC, in one-way ANOVA followed by Tukey.
Figure 5
Figure 5
Cytokine production and suppression of mitogen-induced proliferation of naïve T cells by MC-iDC-stimulated T cells. (A) Representative and cumulative data (n = 3) on intracellular TGF-β production by CD4+CD25+ T lymphocytes submitted to different stimuli (none, or coculture with MC, MC-iDC, or iDCs). (B) Representative and cumulative data (n = 3) on intracellular IL-10 production by CD4+CD25+ T lymphocytes submitted to different stimuli (none, or coculture with MC, MC-iDC, or iDCs). (C) Representative and cumulative data (n = 3) on the effect of MC-iDC-stimulated CD4+CD25+ T lymphocytes upon mitogen-induced naïve T cell proliferation; stimulated cells were separated and added to violet cell tracer-labeled naïve CD4+ T lymphocytes stimulated with PHA (1% v/v, Life Technologies) at different cell ratios and the dilution of the cell tracer determined by flow cytometry, iDC- or TW-iDC-stimulated CD4+CD25+ were used as controls (cumulative data refer to the 1:1 cell ratio); only living CD3+ cells were considered and analyzed by one-way ANOVA, followed by Tukey, *p < 0.05, **p < 0.01 vs. iDC; ##p < 0.01 vs. MC-iDC.
Figure 6
Figure 6
Also mast cells of the HMC-1.1 induce tolerogenic iDC that show increased IDO expression. (A) Cumulative data (n = 3) on the capacity of iDCs cocultured with HMC-1.1 cells (HMC-iDC) to trigger allogeneic T lymphocytes proliferation. (B) Cumulative data (n = 3) on the expression of FoxP3 in T cells stimulated by iDC or by HMC-iDC. (C) Evaluation of the TFG-β or IL-10 (D) production by T cells exposed to iDC or HMC-iDC (n = 3). (E) Cumulative data (n = 3) on the effect of HMC-iDC-stimulated CD4+CD25+ T lymphocytes [(HMC-1.1-iDC)-Ly] compared to control iDC-stimulated cells [(iDC)-Ly] upon mitogen-induced naïve T cell proliferation; DC-stimulated T cells were separated and added to violet cell tracer-labeled naïve CD4+ T lymphocytes stimulated with PHA (1% v/v, Life Technologies) in a 1:1 ratio, and the dilution of the cell tracer determined by flow cytometry. (F) Representative dot plot from the CD11c+ isolation and their expression of IDO1 by PCR and iDCs were used as control. (G) Representative and cumulative data (n = 5) on IDO expression by iDCs and HMC-iDC; data were analyzed by Student’s t-test, *p < 0.05; **p < 0.01.
Figure 7
Figure 7
Blocking of H1 or H2 receptors on iDC did not inhibit IDO expression by HMC-iDC, neither blocked their degranulation. (A) The total RNA of CD11c+ cells left alone (iDC), cultured with HMC-1.1 or cultured with H-1 (olopatadine hydrochloride – 50 μg/mL) or H-2 (cimetidine – 50 μg/mL) receptors-blocked HMC-1.1, as indicated by the “+” signal below (n = 3). (B) Frequency of CD11c+IDO+ cells, in which iDC were left alone (iDC) (n = 5), cultured with HMC-1.1 (HMC-iDC) (n = 5), or cultured with H-1 (olopatadine hydrochloride – 50 μg/mL) or H-2 (cimetidine – 50 μg/mL) receptors-blocked HMC-1.1 (n = 3), as indicated by the “+” signal below. (C) HMC-1.1 were left alone, stimulated with PMA (100 nM) or simultaneously stimulated with PMA and treated with sodium cromolyn at different concentrations (from 3.75 to 400 μg/mL) and their degranulation was evaluated by the expression of CD107a (n = 2). (D) Sodium cromolyn (400 μg/mL)-treated HMC-1.1 cocultured with iDC still induce increase in IDO expression by the iDCs, which was evaluated after 16 h of coculture by flow cytometry (n = 3). (E) Frequency of TGF-β+ cells among CD11c+ cells exposed (HMC-iDC) or not to mast cells (iDC) (n = 4). (F) Frequency of TGF-β+ cells among HMC-1.1 CD117+ cells, exposed (iDC-HMC-1.1) or not to iDC (HMC-1.1). Data were analyzed by one-way ANOVA, followed by Tukey, *p < 0.05 vs. iDC.
Figure 8
Figure 8
Mast cells differentiated in vitro and the mast cell lineage HMC-1.1 expressed PD-1 and induced increased expression of PD-L1 on iDC. (A) Cumulative data on PD-1 expression by in vitro-differentiated MC and HMC-1.1 cells (n = 5). (B) PD-L1 and (C) PD-L2 expression by iDCs and HMC-iDC (n = 5); comparison were performed by the unpaired Student’s t-test, *p < 0.05 vs. iDCs. (D) Representative histogram of the effects on IDO expression by iDCs after coculture with HMC-1.1 under different conditions: blocking PD-1 on HMC-1.1, blocking of PD-L1 or of PD-L2 on iDCs. (E) Cumulative data on IDO expression by iDCs (CD11c+ cells) cocultured with HMC-1.1 cells; for these cultures, HMC-1.1 were treated or not with anti-PD-1 and iDCs with anti-PD-L1 or anti-PD-L2 (10 μg/106 cells) (n = 5); an isotype-matched unrelated mAb was used as control for the treatments. (F) qPCR of IDO1 obtained from the RNA of CD11c+ cells isolated by microbeads, from cocultures of iDCs with HMC-1.1 (HMC-iDC) or with anti-PD-1-treated HMC-1.1; data were normalized by β-actin expression (iDC n = 6; HMC-iDC n = 6; HMC-iDC treated with anti-PD-1, n = 4); data were compared by one-way ANOVA followed by the Tukey’s post hoc test, */#p < 0.05 and ***p < 0.001 vs. iDCs; ##p < 0.01 and ###p < 0.001 vs. MC-iDC.
Figure 9
Figure 9
Coculture with HMC-1.1 induced increase in p-STAT-3 content of iDCs and was prevented by anti-PD-1 treatment of HMC-1.1. (A) Representative dot-plot showing the increase in p-STAT-3 content of CD11c+ cells (iDCs) after coculture with HMC-1.1. (B) Cumulative data on the frequency of CD11c+p-STAT-3+ cells among iDCs (n = 5), HMC-iDC (n = 4), and (anti-PD-1-treated HMC-1.1)-iDCs (n = 4); comparison was performed by one-way ANOVA followed by Tukey, *p < 0.05 compared to iDCs, ##p < 0.01 compared to HMC-iDC. (C) Immunoblot for p-STAT-3, STAT-3, and β-actin from iDC, HMC-iDC, or iDC cultured with HMC-1.1 treated with PD-1 (HMC-iDC + PD-1). (D) JSI-124 (0.5 μM) inhibited p-STAT-3 expression by IFN-α (20 ng/mL)-stimulated iDC. (E) qPCR of IDO1 from the RNA of CD11c+ cells, CD11c+ cultured with HMC-1.1 (HMC-iDC), or with iDC treated with JSI-124 (0.5 μM) and cultured with HMC-1.1 (n = 3), the CD11c+ were isolated by microbeads. (F) Frequency of IDO+CD11c+ cells detected by flow cytometry among iDCs or among iDC cultured with HMC-1.1 (HMC-iDC), treated or not with JSI-124 (0.5 μM) (n = 3). (G) CD3+ T cell proliferation induced by the different cell populations (iDC n = 6; iDC treated with JSI-124, n = 3; HMC-iDC, n = 3; HMC-iDC exposed to JSI-124, n = 3); comparison among the groups was performed by one-way ANOVA followed by Tukey; (*p < 0.05) compared to iDC and (##p < 0.01) compared to HMC-iDC.
Figure 10
Figure 10
Expression of p-STAT-3 modulated genes by iDCs and HMC-iDC. HMC-1.1-exposed iDC isolated by CD11c+ microbeads demonstrated an increased expression of Rel-B, NFkB1, NFkB2, and SOCS5 and a decreased expression of SOCS-3 that could be blocked by anti-PD-1 treatment of HMC-1.1 cells. (A) After 16 h of coculture, CD11c+ cells exposed to HMC-1.1 or HMC-1.1 treated with anti-PD-1 were isolated, had their total RNA extracted using TRIzol, and the expression of Rel-B, NFkB1, NFkB2, and SOCS5 were determined. (B) After 2 h of coculture, we evaluated the expression of SOCS-3 from the isolated CD11c+ cells.

Similar articles

Cited by

References

    1. Moon TC, Laurent CDS, Morris KE, Marcet C, Yoshimura T, Sekar Y, et al. Advances in mast cell biology: new understanding of heterogeneity and function. Mucosal Immunol (2009) 3:111–28.10.1038/mi.2009.136 - DOI - PubMed
    1. Theoharides TC, Kalogeromitros D. The critical role of mast cells in allergy and inflammation. Ann N Y Acad Sci (2006) 1088:78–99.10.1196/annals.1366.025 - DOI - PubMed
    1. St John AL, Abraham SN. Innate immunity and its regulation by mast cells. J Immunol (2013) 190:4458–63.10.4049/jimmunol.1203420 - DOI - PMC - PubMed
    1. Steinman RM. Dendritic cells: understanding immunogenicity. Eur J Immunol (2007) 37:S53–60.10.1002/eji.200737400 - DOI - PubMed
    1. Banchereau J, Steinman RM. Dendritic cells and the control of immunity. Nature (1998) 392:245–52.10.1038/32588 - DOI - PubMed