

De novo Transcriptome Sequencing and Development of Abscission Zone-Specific Microarray as a New Molecular Tool for Analysis of Tomato Organ Abscission
- PMID: 26834766
- PMCID: PMC4712312
- DOI: 10.3389/fpls.2015.01258
De novo Transcriptome Sequencing and Development of Abscission Zone-Specific Microarray as a New Molecular Tool for Analysis of Tomato Organ Abscission
Abstract
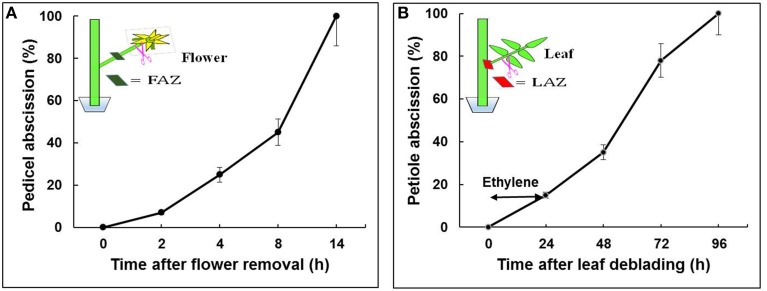
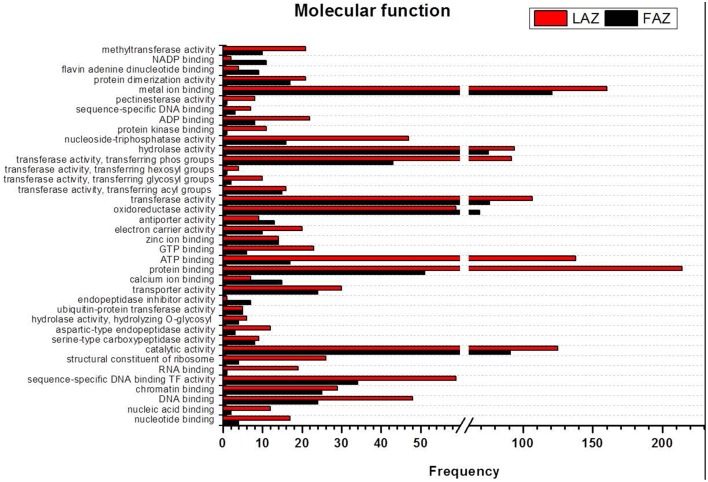
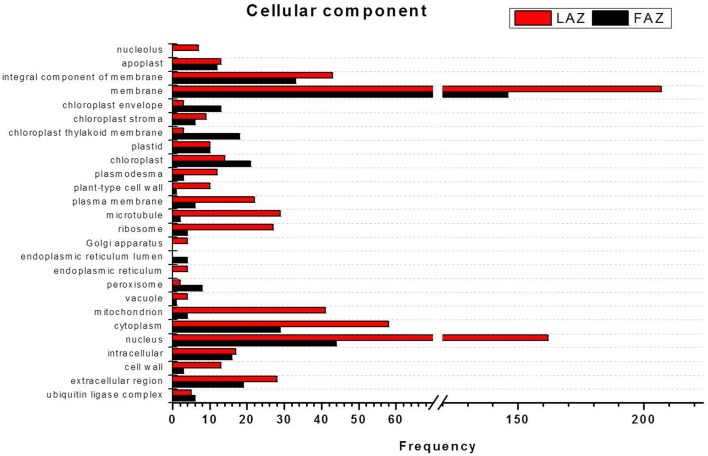
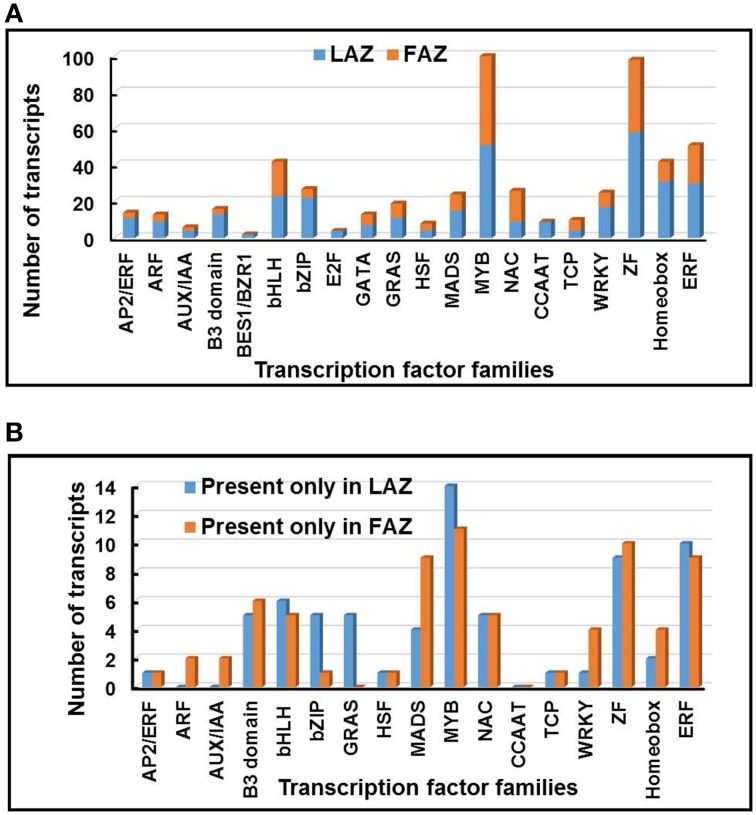
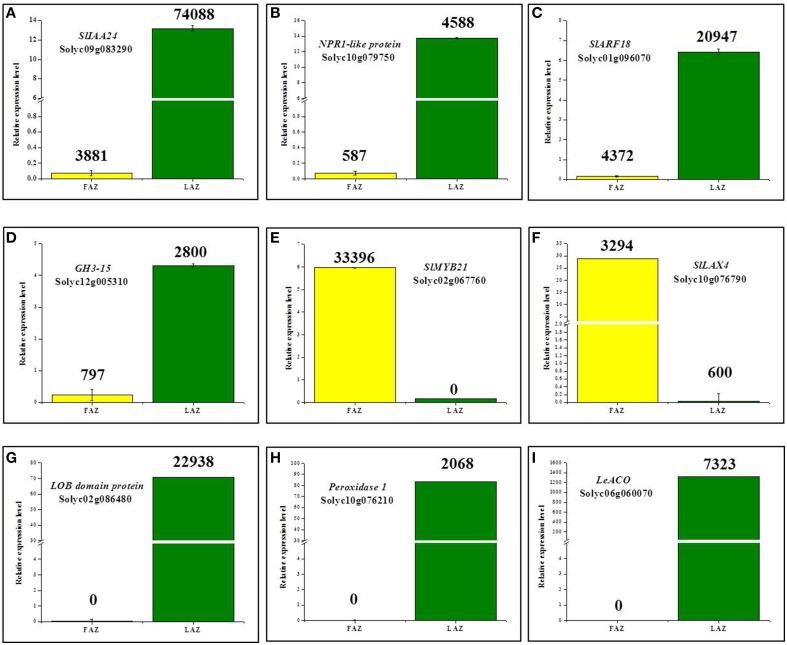
Abscission of flower pedicels and leaf petioles of tomato (Solanum lycopersicum) can be induced by flower removal or leaf deblading, respectively, which leads to auxin depletion, resulting in increased sensitivity of the abscission zone (AZ) to ethylene. However, the molecular mechanisms that drive the acquisition of abscission competence and its modulation by auxin gradients are not yet known. We used RNA-Sequencing (RNA-Seq) to obtain a comprehensive transcriptome of tomato flower AZ (FAZ) and leaf AZ (LAZ) during abscission. RNA-Seq was performed on a pool of total RNA extracted from tomato FAZ and LAZ, at different abscission stages, followed by de novo assembly. The assembled clusters contained transcripts that are already known in the Solanaceae (SOL) genomics and NCBI databases, and over 8823 identified novel tomato transcripts of varying sizes. An AZ-specific microarray, encompassing the novel transcripts identified in this study and all known transcripts from the SOL genomics and NCBI databases, was constructed to study the abscission process. Multiple probes for longer genes and key AZ-specific genes, including antisense probes for all transcripts, make this array a unique tool for studying abscission with a comprehensive set of transcripts, and for mining for naturally occurring antisense transcripts. We focused on comparing the global transcriptomes generated from the FAZ and the LAZ to establish the divergences and similarities in their transcriptional networks, and particularly to characterize the processes and transcriptional regulators enriched in gene clusters that are differentially regulated in these two AZs. This study is the first attempt to analyze the global gene expression in different AZs in tomato by combining the RNA-Seq technique with oligonucleotide microarrays. Our AZ-specific microarray chip provides a cost-effective approach for expression profiling and robust analysis of multiple samples in a rapid succession.
Keywords: RNA-Sequencing; auxin; ethylene; flower pedicel abscission; leaf petiole abscission; oligonucleotide microarray; tomato (Solanum lycopersicum); transcriptome.
Figures
Similar articles
-
Microarray analysis of the abscission-related transcriptome in the tomato flower abscission zone in response to auxin depletion.Plant Physiol. 2010 Dec;154(4):1929-56. doi: 10.1104/pp.110.160697. Epub 2010 Oct 14. Plant Physiol. 2010. PMID: 20947671 Free PMC article.
-
Expression profiling of tomato pre-abscission pedicels provides insights into abscission zone properties including competence to respond to abscission signals.BMC Plant Biol. 2013 Mar 9;13:40. doi: 10.1186/1471-2229-13-40. BMC Plant Biol. 2013. PMID: 23497084 Free PMC article.
-
Role of the KNOTTED1-LIKE HOMEOBOX protein (KD1) in regulating abscission of tomato flower pedicels at early and late stages of the process.Physiol Plant. 2021 Dec;173(4):2103-2118. doi: 10.1111/ppl.13560. Epub 2021 Oct 10. Physiol Plant. 2021. PMID: 34545591
-
Development and regulation of pedicel abscission in tomato.Front Plant Sci. 2015 Jun 11;6:442. doi: 10.3389/fpls.2015.00442. eCollection 2015. Front Plant Sci. 2015. PMID: 26124769 Free PMC article. Review.
-
Abscission zone metabolism impacts pre- and post-harvest fruit quality: a very attaching story.Front Plant Sci. 2025 Jan 27;15:1524893. doi: 10.3389/fpls.2024.1524893. eCollection 2024. Front Plant Sci. 2025. PMID: 39980759 Free PMC article. Review.
Cited by
-
Modifying Anthocyanins Biosynthesis in Tomato Hairy Roots: A Test Bed for Plant Resistance to Ionizing Radiation and Antioxidant Properties in Space.Front Plant Sci. 2022 Feb 24;13:830931. doi: 10.3389/fpls.2022.830931. eCollection 2022. Front Plant Sci. 2022. PMID: 35283922 Free PMC article.
-
Genome-Wide Identification of Histone Modifiers and Their Expression Patterns during Fruit Abscission in Litchi.Front Plant Sci. 2017 Apr 27;8:639. doi: 10.3389/fpls.2017.00639. eCollection 2017. Front Plant Sci. 2017. PMID: 28496451 Free PMC article.
-
Ethylene production and signaling in tomato (Solanum lycopersicum) pollen grains is responsive to heat stress conditions.Plant Reprod. 2018 Dec;31(4):367-383. doi: 10.1007/s00497-018-0339-0. Epub 2018 Jun 9. Plant Reprod. 2018. PMID: 29948007
-
Thidiazuron combined with cyclanilide modulates hormone pathways and ROS systems in cotton, increasing defoliation at low temperatures.Front Plant Sci. 2024 Apr 3;15:1333816. doi: 10.3389/fpls.2024.1333816. eCollection 2024. Front Plant Sci. 2024. PMID: 38633458 Free PMC article.
-
Tomato SlBL4 plays an important role in fruit pedicel organogenesis and abscission.Hortic Res. 2021 Apr 1;8(1):78. doi: 10.1038/s41438-021-00515-0. Hortic Res. 2021. PMID: 33790250 Free PMC article.
References
-
- Abebie B., Lers A., Philosoph-Hadas S., Goren R., Riov J., Meir S. (2008). Differential effects of NAA and 2,4-D in reducing floret abscission in cestrum (Cestrum elegans) cut flowers are associated with their differential activation of Aux/IAA homologous genes. Ann. Bot. 101, 249–259. 10.1093/aob/mcm115 - DOI - PMC - PubMed
-
- Addicott F. T. (1982). Abscission. Berkeley, CA: University of California Press.
-
- Agustí J., Gimeno J., Merelo P., Serrano R., Cercós M., Conesa A., et al. . (2012). Early gene expression events in the laminar abscission zone of abscission-promoted citrus leaves after a cycle of water stress/rehydration: involvement of CitbHLH1. J. Exp. Bot. 63, 6079–6091. 10.1093/jxb/ers270 - DOI - PMC - PubMed
-
- Agustí J., Merelo P., Cercós M., Tadeo F. R., Talón M. (2009). Comparative transcriptional survey between laser-microdissected cells from laminar abscission zone and petiolar cortical tissue during ethylene-promoted abscission in citrus leaves. BMC Plant Biol. 9:127. 10.1186/1471-2229-9-127 - DOI - PMC - PubMed
LinkOut - more resources
Full Text Sources
Other Literature Sources
Molecular Biology Databases