Strain-rate Dependence of Elastic Modulus Reveals Silver Nanoparticle Induced Cytotoxicity
- PMID: 26834855
- PMCID: PMC4732735
- DOI: 10.5772/61328
Strain-rate Dependence of Elastic Modulus Reveals Silver Nanoparticle Induced Cytotoxicity
Abstract
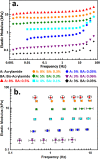
Force-displacement measurements are taken at different rates with an atomic force microscope to assess the correlation between cell health and cell viscoelasticity in THP-1 cells that have been treated with a novel drug carrier. A variable indentation-rate viscoelastic analysis, VIVA, is employed to identify the relaxation time of the cells that are known to exhibit a frequency dependent stiffness. The VIVA agrees with a fluorescent viability assay. This indicates that dextran-lysozyme drug carriers are biocompatible and deliver concentrated toxic material (rhodamine or silver nanoparticles) to the cytoplasm of THP-1 cells. By modelling the frequency dependence of the elastic modulus, the VIVA provides three metrics of cytoplasmic viscoelasticity: a low frequency modulus, a high frequency modulus and viscosity. The signature of cytotoxicity by rhodamine or silver exposure is a frequency independent twofold increase in the elastic modulus and cytoplasmic viscosity, while the cytoskeletal relaxation time remains unchanged. This is consistent with the known toxic mechanism of silver nanoparticles, where metabolic stress causes an increase in the rigidity of the cytoplasm. A variable indentation-rate viscoelastic analysis is presented as a straightforward method to promote the self-consistent comparison between cells. This is paramount to the development of early diagnosis and treatment of disease.
Keywords: VIVA; cell viscoelasticity; dextran; elastic modulus; nano-indentation; nanogel; silver cytotoxicity; silver nanoparticle; standard linear solid model; strain-rate dependent elasticity.
Figures


Similar articles
-
AFM-based indentation method for measuring the relaxation property of living cells.J Biomech. 2021 Jun 9;122:110444. doi: 10.1016/j.jbiomech.2021.110444. Epub 2021 Apr 19. J Biomech. 2021. PMID: 33933864
-
Measuring viscoelasticity of soft samples using atomic force microscopy.J Biomech Eng. 2009 Sep;131(9):094507. doi: 10.1115/1.3194752. J Biomech Eng. 2009. PMID: 19725704
-
Engineering hydrogel viscoelasticity.J Mech Behav Biomed Mater. 2019 Jan;89:162-167. doi: 10.1016/j.jmbbm.2018.09.031. Epub 2018 Sep 21. J Mech Behav Biomed Mater. 2019. PMID: 30286375
-
Method for quantitative measurements of the elastic modulus of biological cells in AFM indentation experiments.Methods. 2013 Apr 1;60(2):202-13. doi: 10.1016/j.ymeth.2013.03.037. Epub 2013 Apr 30. Methods. 2013. PMID: 23639869 Review.
-
[Cardiovascular physiology. Elasticity and viscoelasticity of the circulatory system. I. Physical basis. II. Arteries].Rev Port Cardiol. 1994 Apr;13(4):337-54,292. Rev Port Cardiol. 1994. PMID: 7917383 Review. Portuguese.
Cited by
-
Suppression of detyrosinated microtubules improves cardiomyocyte function in human heart failure.Nat Med. 2018 Aug;24(8):1225-1233. doi: 10.1038/s41591-018-0046-2. Epub 2018 Jun 11. Nat Med. 2018. PMID: 29892068 Free PMC article.
-
Viscoelasticity in simple indentation-cycle experiments: a computational study.Sci Rep. 2020 Aug 6;10(1):13302. doi: 10.1038/s41598-020-70361-y. Sci Rep. 2020. PMID: 32764637 Free PMC article.
-
Mitochondrial DNA 3243A>G heteroplasmy is associated with changes in cytoskeletal protein expression and cell mechanics.J R Soc Interface. 2017 Jun;14(131):20170071. doi: 10.1098/rsif.2017.0071. J R Soc Interface. 2017. PMID: 28592659 Free PMC article.
-
Under pressure: Hydrogel swelling in a granular medium.Sci Adv. 2021 Feb 12;7(7):eabd2711. doi: 10.1126/sciadv.abd2711. Print 2021 Feb. Sci Adv. 2021. PMID: 33579709 Free PMC article.
-
Measuring nanoscale viscoelastic parameters of cells directly from AFM force-displacement curves.Sci Rep. 2017 May 8;7(1):1541. doi: 10.1038/s41598-017-01784-3. Sci Rep. 2017. PMID: 28484282 Free PMC article.
References
-
- Engler A.J., Sen S, Sweeney H.L., Discher D.E., (2006) Matrix Elasticity Directs Stem Cell Lineage Specification, Cell, 126: 677–689. - PubMed
-
- Fritsch A, Hockel M, Kiessling T, Nnetu K.D., Wetzel F, Zink M, Kas J.A., (2010) Are Biomechanical Changes Necessary for Tumor Progression?, Nature Physics, 6: 730–733.
-
- Hoyert D.L., Xu J, (2011) Deaths: Preliminary Data for 2011, National Vital Statistics Reports, 61, 6: 1–52. - PubMed
Grants and funding
LinkOut - more resources
Full Text Sources
Other Literature Sources
