Review
. 2016 Jan 28;8(1):59-72.
doi: 10.4329/wjr.v8.i1.59.

General review of magnetic resonance elastography

Affiliations
Review

General review of magnetic resonance elastography

Gavin Low et al. World J Radiol. .

Abstract

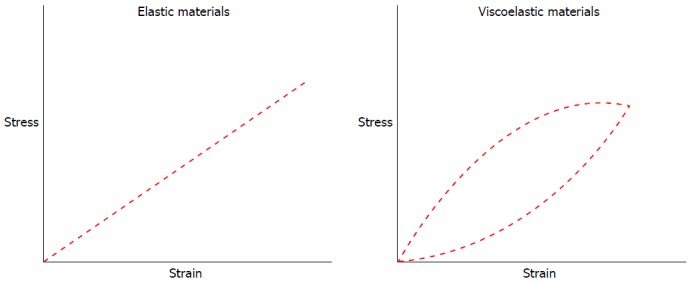
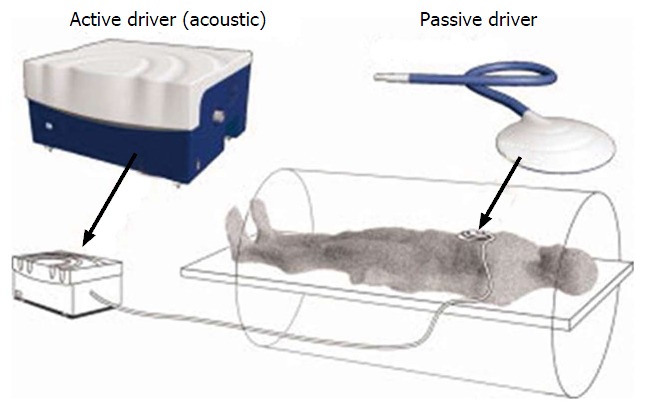
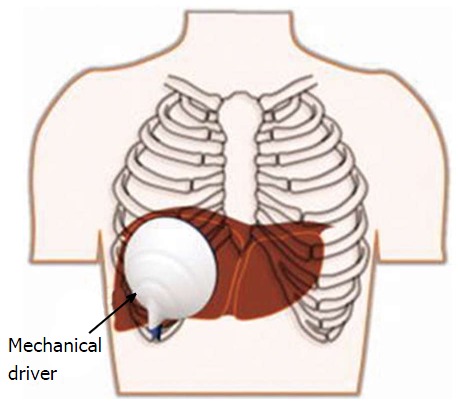
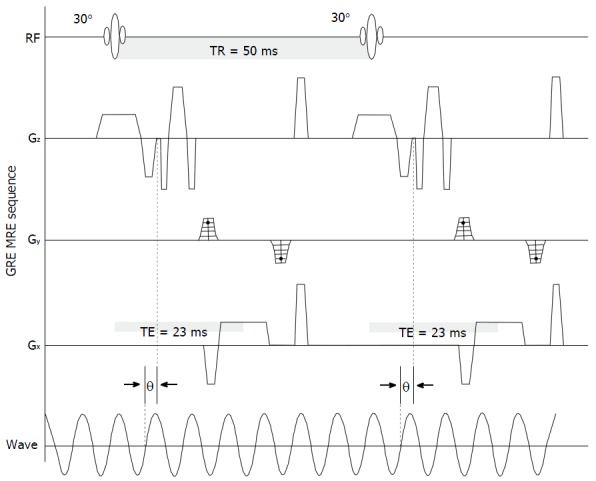
Magnetic resonance elastography (MRE) is an innovative imaging technique for the non-invasive quantification of the biomechanical properties of soft tissues via the direct visualization of propagating shear waves in vivo using a modified phase-contrast magnetic resonance imaging (MRI) sequence. Fundamentally, MRE employs the same physical property that physicians utilize when performing manual palpation - that healthy and diseased tissues can be differentiated on the basis of widely differing mechanical stiffness. By performing "virtual palpation", MRE is able to provide information that is beyond the capabilities of conventional morphologic imaging modalities. In an era of increasing adoption of multi-parametric imaging approaches for solving complex problems, MRE can be seamlessly incorporated into a standard MRI examination to provide a rapid, reliable and comprehensive imaging evaluation at a single patient appointment. Originally described by the Mayo Clinic in 1995, the technique represents the most accurate non-invasive method for the detection and staging of liver fibrosis and is currently performed in more than 100 centers worldwide. In this general review, the mechanical properties of soft tissues, principles of MRE, clinical applications of MRE in the liver and beyond, and limitations and future directions of this discipline -are discussed. Selected diagrams and images are provided for illustration.

Keywords: Elasticity imaging techniques; Emerging applications; Fibrosis; Liver disease; Magnetic resonance elastography.


Figures

Figure 1
Figure 1
Schematic diagram illustrates the stress-strain relationship of elastic materials and viscoelastic materials.
Figure 2
Figure 2
Schematic diagram demonstrates the set up for an magnetic resonance elastography examination using a pneumatic actuator system. Reproduced with permission from “John Wiley and Sons”, Venkatesh et al[12].
Figure 3
Figure 3
Typical transcostal position of the passive driver for magnetic resonance elastography assessment of the liver. Reproduced with permission from “John Wiley and Sons”, Venkatesh et al[12].
Figure 4
Figure 4
Gradient-echo magnetic resonance imaging sequence with motion sensitizing gradient applied along the slice selection direction (GZ) to detect cyclic motion in that direction. A phase offset (θ) between the MSG and the acoustic driver was adjusted to acquire wave images at different time intervals during a single period of wave motion. Reproduced with permission from “Elsevier”, Yin et al[13]. MSG: Motion sensitizing gradient.
Math 1
Math 1
Math(A1).
Figure 5
Figure 5
Largest volume of collective experience on magnetic resonance elastography is in the investigation of chronic liver disease. A: A 32-year-old female with PSC disease stage 1 with normal liver stiffness; B: A 53-year-old female with hepatitis C and presumed cirrhosis, which was determined by MRE results. PSC: Primary sclerosing cholangitis; MRE: Magnetic resonance elastography.
Figure 6
Figure 6
Liver stiffness on magnetic resonance elastography increases systematically with greater fibrosis extent as determined by liver biopsy. Reproduced with permission from “Elsevier” Yin et al[13].
Figure 7
Figure 7
A patient with non-alcoholic steatohepatitis has a cirrhotic liver with stigmata of portal hypertension including splenomegaly, ascites, esophageal varices, splenorenal shunts and other collaterals. The left image shows mechanical waves throughout the liver and the spleen. In the resulting elastogram (right), both the liver and the spleen show very high shear stiffness values of over 20 kPa.
Figure 8
Figure 8
A 2-dimensional multislice magnetic resonance elastography sequence was used to collect 3-dimensional vector wave images in a healthy volunteer at 90 Hz. The elastogram from the 3D direct inversion is shown. The mean shear stiffness of the right kidney is 5.8 + 0.34 kPa and the left kidney is 6.1 + 0.42 kPa. 3D: 3-dimensional.
Figure 9
Figure 9
A 39-year-old healthy male volunteer. Axial images of the brain including 60 Hz curl images and the 3D direct inversion elastogram. 3D: 3-dimensional.

Similar articles

Cited by

References

    1. Sarvazyan A, Hall TJ, Urban MW, Fatemi M, Aglyamov SR, Garra BS. An overview of elastography - an emerging branch of medical imaging. Curr Med Imaging Rev. 2011;7:255–282. - PMC - PubMed
    1. Manduca A, Oliphant TE, Dresner MA, Mahowald JL, Kruse SA, Amromin E, Felmlee JP, Greenleaf JF, Ehman RL. Magnetic resonance elastography: non-invasive mapping of tissue elasticity. Med Image Anal. 2001;5:237–254. - PubMed
    1. Gao L, Parker KJ, Lerner RM, Levinson SF. Imaging of the elastic properties of tissue--a review. Ultrasound Med Biol. 1996;22:959–977. - PubMed
    1. Parker KJ, Doyley MM, Rubens DJ. Imaging the elastic properties of tissue: the 20 year perspective. Phys Med Biol. 2011;56:R1–R29. - PubMed
    1. Vappou J. Magnetic resonance- and ultrasound imaging-based elasticity imaging methods: a review. Crit Rev Biomed Eng. 2012;40:121–134. - PubMed