. 2015 Oct 15:4:1075.
doi: 10.12688/f1000research.7201.1. eCollection 2015.

MinION Analysis and Reference Consortium: Phase 1 data release and analysis

Affiliations

MinION Analysis and Reference Consortium: Phase 1 data release and analysis

Camilla L C Ip et al. F1000Res. .

Abstract

The advent of a miniaturized DNA sequencing device with a high-throughput contextual sequencing capability embodies the next generation of large scale sequencing tools. The MinION™ Access Programme (MAP) was initiated by Oxford Nanopore Technologies™ in April 2014, giving public access to their USB-attached miniature sequencing device. The MinION Analysis and Reference Consortium (MARC) was formed by a subset of MAP participants, with the aim of evaluating and providing standard protocols and reference data to the community. Envisaged as a multi-phased project, this study provides the global community with the Phase 1 data from MARC, where the reproducibility of the performance of the MinION was evaluated at multiple sites. Five laboratories on two continents generated data using a control strain of Escherichia coli K-12, preparing and sequencing samples according to a revised ONT protocol. Here, we provide the details of the protocol used, along with a preliminary analysis of the characteristics of typical runs including the consistency, rate, volume and quality of data produced. Further analysis of the Phase 1 data presented here, and additional experiments in Phase 2 of E. coli from MARC are already underway to identify ways to improve and enhance MinION performance.

Keywords: MinION; NanoOK; data release; long reads; marginAlign; minoTour; nanopore sequencing; third-generation sequencing.


Conflict of interest statement

Competing interests: Ewan Birney is a paid consultant of Oxford Nanopore Technologies. All flow cells and library preparation kits were provided by Oxford Nanopore Technologies free of charge.

Figures

Figure 1.
Figure 1.. The Oxford Nanopore sequencing process.
( A) Suspended library molecules are concentrated near nanopores embedded in the membrane. A voltage applied across the membrane induces a current through the nanopores. ( B) Schematic of a library molecule, showing dsDNA ligated to a leader adapter pre-loaded with a motor protein and a hairpin adapter pre-loaded with a hairpin protein, and the tethering oligos. ( C) Sequencing starts from the 5’ end of the leader adapter. The motor protein unwinds the dsDNA allowing single-stranded DNA to pass through the pore. ( D) A flow cell contains 512 channels (grey), each channel consisting of 4 wells (white). Each well contains a pore (blue) and a sensor. At any given time, the device is recording the data stream from the wells of the active well-group, in this example, g1. ( E) Perturbation in the current across the nanopore is measured 3,000 times per second as ssDNA passes through the nanopore. ( F) The ‘bulk data’ are segmented into discrete ‘events’ of similar consecutive measurements. The 5-mer corresponding to each event is inferred using a statistical model. ( G) The 1D base-calls are inferred separately for the template and complement event signals. ( H) Alignment of the 2D base-calls from the event signals from both, and the 1D base-calls are used to constrain the 2D base-calls.
Figure 2.
Figure 2.. Initial active pore count.
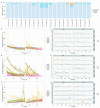
The distribution of the number of active pores (lower series) and the cumulative total (upper series) for well-groups 1 to 4 are shown for the 20 flow cells used in this study. The measurement for each experiment was made either during the Platform QC or at the beginning of the 48h script.
Figure 3.
Figure 3.. Event yield for 20 experiments.
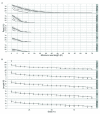
Read count as ( A) raw counts and ( B) a percentage. Event yield as ( C) raw counts and ( D) a percentage. The ( E) entire distribution of callable read lengths and ( F) a subset showing the lower part in more detail. The 6 experiments that adhered to the MARC protocol and sequenced for at least 46h are marked with a black dot. The upper callable threshold of 230,000 events is indicated by a red dashed line.
Figure 4.
Figure 4.. Event generation profile.
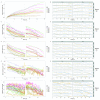
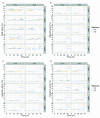
( A, B) Cumulative event yield. ( C, D) Event yield per hour. ( E, F) Percentage of the 512 pores that were active. ( G, H) Event sequencing rate per pore. ( I, J) Length of reads in events. The left plots show the values for each experiment, coloured by lab. The right plots show the values for each experiment more clearly. The DNA input mass for each experiment is provided in ( B). Data collected during the first hour, the hour following the pore-group switch (24–25h) and the last hour (47–48h) are omitted for clarity.
Figure 5.
Figure 5.. Relationship between number of initial g1 pores, read count and event yield.
The phase of the experiment is indicated by shape. The experiments that adhered to the MARC protocol for both the wet-lab and sequencing components are shown in blue.
Figure 6.
Figure 6.. Read yield of target and control samples.
( A) Proportion of target, control and unclassified 2D reads for each experiment. The read production rate (reads pore -1 h -1) for ( B, C) target DNA, ( E, F) control DNA, and ( F, G) reads that could not be aligned uniquely either to the target or control reference sequence.
Figure 7.
Figure 7.. Summary of 1D and 2D base-calls.
( A) The relationship between event lengths and the length of 2D base-calls is linear, with a slope of 0.367 (ratio of 2.7 : 1). The distribution of ( B) total number of reads, ( C) read length; ( D) total base yield; and ( E) mean base quality of the target sample across the 20 experiments.
Figure 8.
Figure 8.. Base quality variation over time for 1D and 2D base-calls of the target sample.
The median base quality for template, complement, all 2D, and 2D pass bases in 15 minute intervals for target DNA reads. Statistics are inferred from data from the first start of each sequencing experiment. Data collected during the first hour, the hour following the pore-group switch (24–25h) and the last hour (47–48h) are omitted for clarity.
Figure 9.
Figure 9.. Variation in base quality of 2D and 2D pass base-calls during an experiment.
The mean base quality for 15 minute intervals for ( A) all 2D reads and ( B) 2D pass reads in each experiment.
Figure 10.
Figure 10.. Effect of EM correction on BWA-MEM alignments of target 2D base-calls.
( A) The total percentage error of each read, grouped by laboratory, for values computed from BWA-MEM alignments pre- and post-EM correction; ( B) the median percentage error over time for alignments by BWA-MEM for each experiment; and ( C) the median percentage error over time for alignments by BWA-MEM followed by EM correction for each experiment, showing the median total, miscall, insertion and deletion error for each 15 minute interval.
Figure 11.
Figure 11.. Percentage of 2D pass reads produced over time.
Boxplots showing the proportion of 2D pass reads started in each 15 minute interval were plotted for the 20 experiments (grey), and the median values connected with a black line.
Figure 12.
Figure 12.. Relationship between accuracy and base quality.
( A) The percentage error (on a log scale) plotted against the mean base quality of each 2D read. Reads from the Phase 1a and 1b experiments are distinguished by shape and the pass and fail read types by colour. The relationship between total error, and the miscall, insertion and deletion components, are shown separately. The linear regression line demonstrates that base quality and error are related by an exponential function. ( B) The variation in 10 (-Q/1000)/TotalError over time for each experiment. Although the value should be constant for all reads, the value declines over time. The characteristic unusual values occurring every 4h suggest that base quality is not as well correlated with accuracy for reads that were being sequenced during a bias-voltage adjustment.
Figure 13.
Figure 13.. GC content and best perfect subsequences.
The distribution of ( A) read GC content as a percentage; and ( B) the length of the best perfect subsequences of target 2D pass and fail base-calls from each experiment.
Figure S1.
Figure S1.. Proportion of long reads and data in long reads.
( A) The percentage of reads with a length greater than a specified read length. A boxplot of the percentage of reads was plotted for each read in multiples of 1000 until the read percentage dropped to 1%. Typically, 21% of the reads had a length of over 20,000 events, and 7.6%, 4.0%, 4.4% and 3.6% of the reads had over 10,000 bases in the template, complement, 2D and 2D ‘pass’ base-calls. ( B) The length of reads containing a specified percentage of the data. Typically, 50% of the reads had a length of at least 13,600 events, and 5,500, 5,600, 6,000 and 6,300 bases for the template, complement, 2D and 2D ‘pass’ base-calls. Similarly, 5% of the reads had a length of at least 56,600 events, and 14,500, 13,000, 13,500 and 13,600 bases for the template, complement, 2D and 2D ‘pass’ base-calls.
Figure S2.
Figure S2.. Cumulative event yield over time by phase.
The cumulative event yield was plotted for all reads from each experiment and coloured by the experimental phase. The yield for each phase has not affected the rate of event production over time or the total events produced. The total yield was not dependent on the input DNA mass (for input DNA mass, see SI Table 4). The re-mux and library reload at 24h is shown by a vertical dashed line.
Figure S3.
Figure S3.. Additional factors affecting event yield over time.
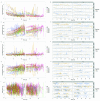
( A, B) Percentage of template events that are skips (i.e., event moves with a step length > 1). ( C, D) Percentage of template events that are stays (i.e., event moves with a step length = 0). ( E, F) Percentage of complement events that are skips (i.e., event moves with a step length > 1). ( G, H) Percentage of complement events that are stays (i.e., event moves with a step length = 0). ( I, J) Mean number of minutes that a pore is idle between sequencing instances. The number of skip and stay events was inferred for the template and complement strands of each reads and allocated to the 15 minute interval since the start of the experiment. The refill plot was based on values computed with poreQC version 0.2.10. The number of seconds the pore was idle before sequencing commenced was computed for each read, excluding the first read and any read which followed a read which did not result in a valid set of events, allocated to the 15 minute window in which the read commenced, grouped by experiment, and the median plotted for each experiment. Only data for the first sequencing script start is shown. The first hour, the hour following the pore-group switch and the last hour, are not shown for clarity. The 24h re-mux and library reload is shown by a vertical dashed line.
Figure S4.
Figure S4.. Yield and quality of 1D and 2D base-calls over time.
Each row shows ( A) read count, ( B) read count per pore per hour, ( C) base yield, ( D) base yield per pore per hour, and ( E) base quality for 1D template and complement reads, 2D reads and the 2D ‘pass’ reads. The values were inferred from the statistics computed by poreQC version 0.2.10 and poreMap version 0.1.1. Only data for the first sequencing script start is shown. The first hour, the hour following the pore-group switch and the last hour, are not shown for clarity. The 24h re-mux and library reload time is shown by a vertical dashed line.
Figure S5.
Figure S5.. Sequencing rate and pore occupancy rate for a typical experiment.
( A) Mean read sequencing rate of the template (light blue) and complement bespoke (green) strands, measured in bases per second, for each 15 minute interval for experiment P1a-Lab2-R2. The effective sequencing rate, computed as the total time taken to sequence bases the template and complement bases, per unit time, per active channel are shown for the template (orange) and complement (dark blue) for the same 15 minute intervals. In a typical experiment like P1a-Lab2-R2, template and complement sequences were produced at a declining rate over the course of 24h, and for both metrics, the rate at which template sequences translocate through the pore decreases more rapidly than the complement sequences. ( B) The percentage of time that active pores were occupied (blue, left axis) and the number of active channels across the device (orange, right axis, maximum of 512), for 15 minute intervals during experiment P1a-Lab2-R2. Active pores continued to produce data at a similar rate until they became inactive, which happened at a relatively uniform rate during an experiment.
Figure S6.
Figure S6.. Error estimates for target 2D base-calls from each phase.
The pre- and post-EM percentage error for BWA-MEM alignments of target 2D base-calls, grouped by phase. There was little difference between the error rate of Phase 1a and 1b experiments.
Figure S7.
Figure S7.. Variation in base-call error across read types and DNA source.
The total error, and the contribution of miscalls, insertions and deletions for 2D base-calls of target reads for ( A) template, complement and 2D base-calls split by the pass and fail classification, and ( B) samples from the target or control DNA, grouped by laboratory. The percentage error was estimated from BWA-MEM alignments without EM correction, and thus, higher than the corresponding values in Figure 10. However, these values are sufficient to show that the error rate of the 1D template and complement base-calls are similar, and about twice that of the 2D base-calls. And the error of the base-calls from pass reads are always lower than for the fail reads of the same read type. Similarly, the error estimates were similar for target and control base-calls across all laboratories.
Figure S8.
Figure S8.. Variation in miscall, insertion and deletion error over time for 2D base-calls.
These data are the same as shown in Figure 10C, inferred from BWA-MEM alignments followed by EM correction, but separated by phase and lab to more clearly show the trends over time for each experiment. The total percentage error of individual reads, and the miscall, insertion and deletion components, were almost constant over time, but interrupted by an increase in error for reads that were sequenced during the 4h bias-voltage adjustments.

References

    1. Ammar R, Paton TA, Torti D, et al. : Long read nanopore sequencing for detection of HLA and CYP2D6 variants and haplotypes [version 2; referees: 2 approved]. F1000Res. 2015;4:17 10.12688/f1000research.6037.2 - DOI - PMC - PubMed
    1. Akeson M, Branton D, Kasianowicz JJ, et al. : Microsecond time-scale discrimination among polycytidylic acid, polyadenylic acid, and polyuridylic acid as homopolymers or as segments within single RNA molecules. Biophys J. 1999;77(6):3227–3233. 10.1016/S0006-3495(99)77153-5 - DOI - PMC - PubMed
    1. Ashton PM, Nair S, Dallman T, et al. : MinION nanopore sequencing identifies the position and structure of a bacterial antibiotic resistance island. Nat Biotechnol. 2015;33(3):296–300. 10.1038/nbt.3103 - DOI - PubMed
    1. Bayley H: Sequencing single molecules of DNA. Curr Opin Chem Biol. 2006;10(6):628–637. 10.1016/j.cbpa.2006.10.040 - DOI - PubMed
    1. Check Hayden E: Nanopore genome sequencer makes its debut. Nat News. 2012. 10.1038/nature.2012.10051 - DOI