. 2016 Jan 20:3:2.
doi: 10.3389/fvets.2016.00002. eCollection 2016.

Development of the Chick Microbiome: How Early Exposure Influences Future Microbial Diversity

Affiliations

Development of the Chick Microbiome: How Early Exposure Influences Future Microbial Diversity

Anne L Ballou et al. Front Vet Sci. .

Abstract

The concept of improving animal health through improved gut health has existed in food animal production for decades; however, only recently have we had the tools to identify microbes in the intestine associated with improved performance. Currently, little is known about how the avian microbiome develops or the factors that affect its composition. To begin to address this knowledge gap, the present study assessed the development of the cecal microbiome in chicks from hatch to 28 days of age with and without a live Salmonella vaccine and/or probiotic supplement; both are products intended to promote gut health. The microbiome of growing chicks develops rapidly from days 1-3, and the microbiome is primarily Enterobacteriaceae, but Firmicutes increase in abundance and taxonomic diversity starting around day 7. As the microbiome continues to develop, the influence of the treatments becomes stronger. Predicted metagenomic content suggests that, functionally, treatment may stimulate more differences at day 14, despite the strong taxonomic differences at day 28. These results demonstrate that these live microbial treatments do impact the development of the bacterial taxa found in the growing chicks; however, additional experiments are needed to understand the biochemical and functional consequences of these alterations.

Keywords: Salmonella; chicken; gut development; microbiome development; probiotic.


Figures

Figure 1
Figure 1
As the cecal microbiome develops, the dominant taxa shift from Gram-negative to Gram-positive bacteria. A heatmap of taxonomic groups present in untreated (DC) samples over time was generated with Qiime. The composition of the microbiome in DC animals was evaluated to identify trends in the development of the normal microbiome over time. There is a consistent decrease in the proportion of Enterobacteriaceae and Enterococcus over time, and an increase in levels of Clostridiales groups like Ruminococcus and Oscillospira. Sequence coverage was normalized to 16,260 reads/sample.
Figure 2
Figure 2
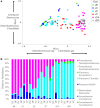
Age is the dominant factor in the composition of the microbiome. (A) Principal coordinate analysis of samples was conducted using Primer-E and samples were labeled based on age. Samples are clustered on two axes based on a multi-dimensional analysis of their sequence diversity and abundance. As the animals age, their microbiome increases in complexity but decreases in variability between samples, even between treatment groups. The effect of age was stronger than the effect of vaccine or probiotic. Differences between all time points were significant at permutational P-value <0.05, with the exception of day 0 vs. days 1 and 3. Coordinate loading for each principal coordinate shows the primary taxonomic groups contributing to each axis. Each data point represents a sample in the appropriate time point, and samples from all treatment groups are included in the analysis. (B) The phylum and class of sequences with an average relative abundance of 1% or greater are displayed by time point and treatment. All treatment groups started with high levels of Gammaproteobacteria that shifted with age into a Firmicutes-dominated community with large numbers of Clostridia. Taxonomy assignments were generated with QIIME, and PCoA plots were generated with Primer-E. Sequence coverage was normalized to 16,260 reads/sample.
Figure 3
Figure 3
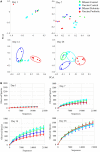
Principal coordinate analysis and rarefaction analyses demonstrate the impact of the treatments over time. (A) Principal coordinate analysis generated with Primer-E demonstrates the effect of treatments at 1, 7, 14, and 28 days of age. There are no significant treatment differences at day 1. By day 7, treatment groups are statistically different based on PERMANOVA tests. Treatment groups cluster visually at days 14 and 28. All treatment groups at days 7, 14, and 28 were different at permutational P < 0.05. (B) Rarefaction of observed species (unique OTUs) at individual time points was conducted using QIIME, and demonstrate the rapid development of taxonomic diversity. Treatment groups show similar diversity at Day 1. At day 7, DP and VP tend to have lower diversity than VC (P = 0.078 and 0.054, respectively). At day 14, DP and VP diversity is significantly lower than DC and VC diversity (P < 0.05). By day 28, community diversity is similar between treatments. Sequence coverage was normalized for each time point individually: day 1 (16,577 reads/sample), day 7 (16,668 reads/sample), day 14 (20,263 reads/sample), and day 28 (20,263 reads/sample).
Figure 4
Figure 4
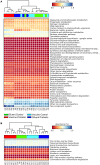
At both days 14 and 28, the VP group shows the greatest divergence in predicted metagenomic content. PICRUSt was used to generate a list of genes inferred to be present in the samples, their relative abundance, and the gene pathways with which they are associated. A heatmap was generated with STAMP. Samples were clustered using a nearest neighbor metric, and pathways were colored based on their percent abundance relative to all measured genes. All listed gene groups are significantly different between treatment groups with an effect size >0.70 and FDR-corrected P < 0.01. The combination of vaccine and probiotic treatments stimulates changes in several gene groups and pathways at day 14 (A), namely increases in chemotaxis, two-component system, flagellar assembly, and bacterial motility. Decreases in the VP group include metabolic processes, such as amino acid metabolism, DNA replication, and protein translation. (B) There are fewer significantly different pathways at day 28 and changes are largely related to cell metabolism.
Figure 5
Figure 5
Comparison of taxonomic and gene-group abundance trends at days 14 and 28. Relative abundance of taxonomic groups and predicted abundance of functional gene groups demonstrate the stability of gene-group abundances relative to changes in taxonomic groups. Relative abundance tables for taxa and gene group were assembled and used to generate area charts of all samples at days 14 and 28. The relative abundance of every identified taxonomic or functional gene group is shown for each sample; (A) predicted gene groups at day 14, (B) taxonomic groups at day 14, (C) predicted gene groups at day 28, (D) taxonomic groups at day 28. At day 14, there are clear taxonomic differences between treatments (A), and smaller changes in the abundance of a few gene groups (B). At day 28, taxonomic changes (D) are accompanied by few visible changes in gene-group abundance (C).

References

    1. Mohan B, Kadirvel R, Natarajan A, Bhaskaran M. Effect of probiotic supplementation on growth, nitrogen utilisation and serum cholesterol in broilers. Br Poult Sci (1996) 37:395–401.10.1080/00071669608417870 - DOI - PubMed
    1. Roos NM, de, Katan MB. Effects of probiotic bacteria on diarrhea, lipid metabolism, and carcinogenesis: a review of papers published between 1988 and 1998. Am J Clin Nutr (2000) 71:405–11. - PubMed
    1. Marangon S, Busani L. The use of vaccination in poultry production. Rev Sci Tech (2007) 26:265–74. - PubMed
    1. Saif YM. Diseases of Poultry. Hoboken, NJ: Wiley; (2003).
    1. Oakley BB, Lillehoj HS, Kogut MH, Kim WK, Maurer JJ, Pedroso A, et al. The chicken gastrointestinal microbiome. FEMS Microbiol Lett (2014) 360:100–12.10.1111/1574-6968.12608 - DOI - PubMed