. 2015 Oct;2(4):045001.
doi: 10.1117/1.NPh.2.4.045001. Epub 2015 Oct 12.

Differential pathlength factor informs evoked stimulus response in a mouse model of Alzheimer's disease

Affiliations

Differential pathlength factor informs evoked stimulus response in a mouse model of Alzheimer's disease

Alexander J Lin et al. Neurophotonics. 2015 Oct.

Abstract

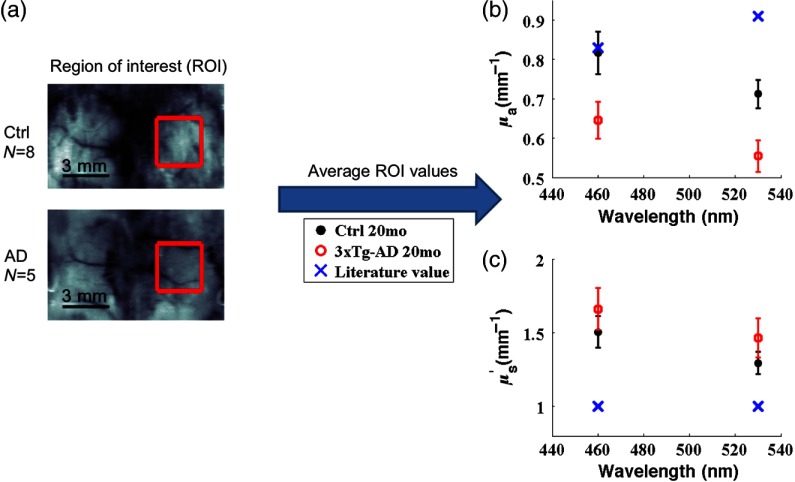
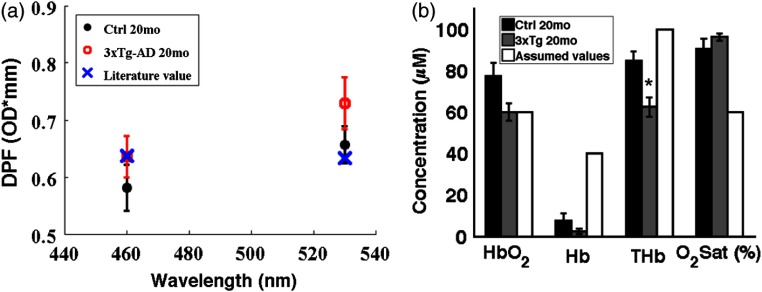
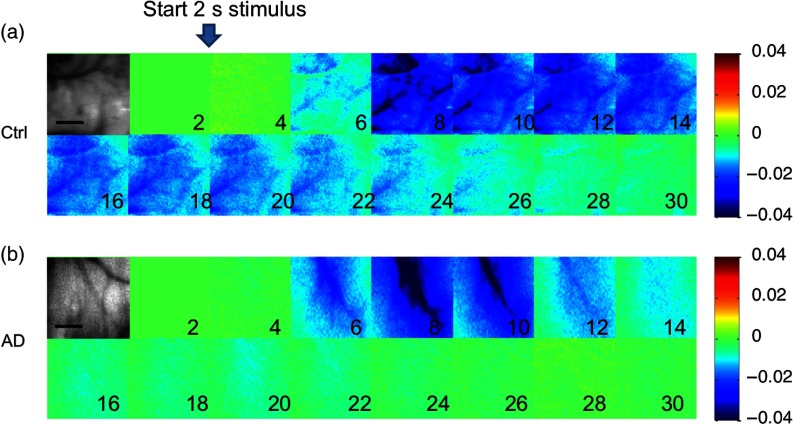
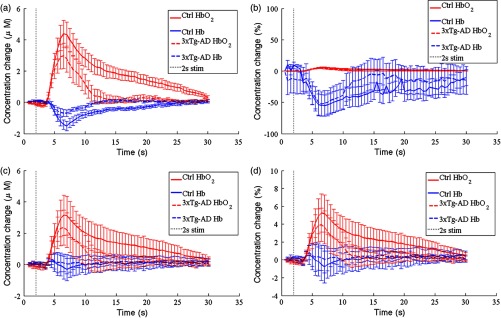
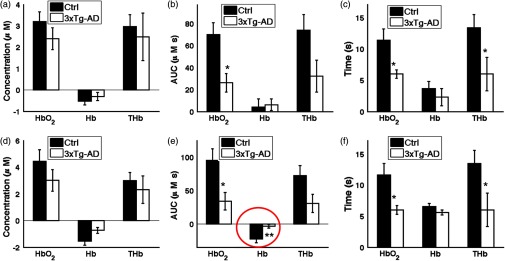
Baseline optical properties are typically assumed in calculating the differential pathlength factor (DPF) of mouse brains, a value used in the modified Beer-Lambert law to characterize an evoked stimulus response. We used spatial frequency domain imaging to measure in vivo baseline optical properties in 20-month-old control ([Formula: see text]) and triple transgenic APP/PS1/tau (3xTg-AD) ([Formula: see text]) mouse brains. Average [Formula: see text] for control and 3xTg-AD mice was [Formula: see text] and [Formula: see text], respectively, at 460 nm; and [Formula: see text] and [Formula: see text], respectively, at 530 nm. Average [Formula: see text] for control and 3xTg-AD mice was [Formula: see text] and [Formula: see text], respectively, at 460 nm; and [Formula: see text] and [Formula: see text], respectively, at 530 nm. The calculated DPF for control and 3xTg-AD mice was [Formula: see text] and [Formula: see text] OD mm, respectively, at 460 nm; and [Formula: see text] and [Formula: see text] OD mm, respectively, at 530 nm. In hindpaw stimulation experiments, the hemodynamic increase in brain tissue concentration of oxyhemoglobin was threefold larger and two times longer in the control mice compared to 3xTg-AD mice. Furthermore, the washout of deoxyhemoglobin from increased brain perfusion was seven times larger in controls compared to 3xTg-AD mice ([Formula: see text]).

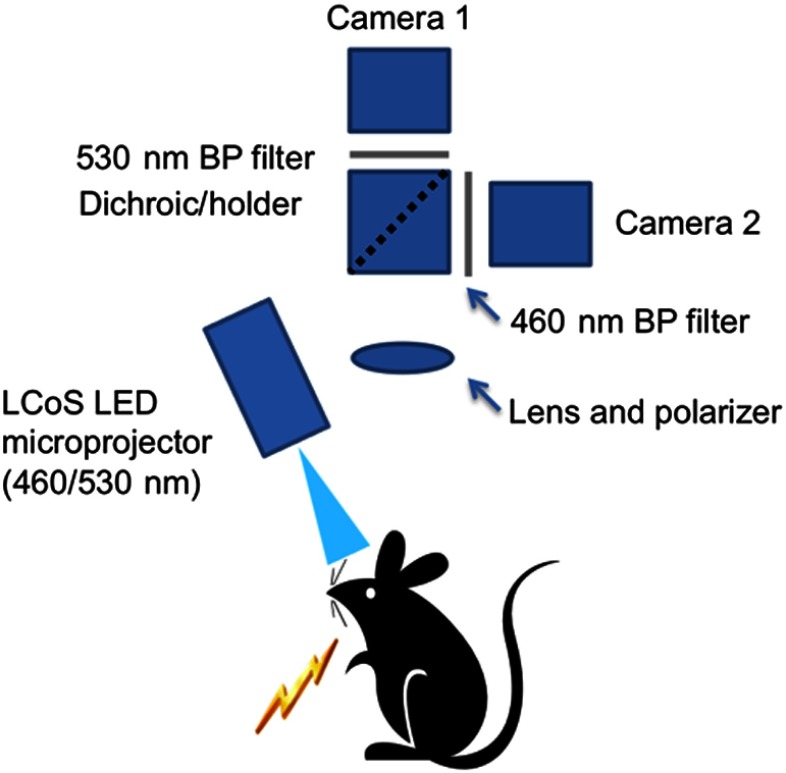
Keywords: LED microprojector; absorption; cerebral metabolic rate of oxygen; functional activation; scattering; spatial frequency domain imaging; tissue optics.


Figures

Fig. 1
Fig. 1
Diagram of flexible LED and modulation element experimental imaging setup (from Ref. 24). All components were controlled with LabVIEW software on a personal computer.
Fig. 2
Fig. 2
Spatial frequency domain imaging (SFDI)-measured μa and μs are different from literature-reported values at 460 and 530 nm. (a) A region of interest (ROI, red square) was selected over the contralateral somatosensory cortex of the stimulated hindlimb. (b) The average and standard error of ROI values in each group are shown for μa and compared to a literature-reported value. (c) The average and standard error of ROI values in each group are shown for μs and compared to a typically assumed literature-reported value of 1mm1.
Fig. 3
Fig. 3
(a) The average and standard error of ROI values in each group are shown for differential pathlength factor (DPF) and compared to a literature-reported value. (b) The average and standard error of HbO2, Hb, THb, and O2 sat in each group are shown and compared to typically literature-reported values.,
Fig. 4
Fig. 4
Representative montage of the normalized reflectance change at 530 nm in the ROI (grayscale image) for (a) controls and (b) 3xTg-AD mice. Stimulation started after 2 s of baseline, lasted for 2 s, and images every 2 s subsequently are shown up to 30 s. Color scale shows normalized changes from 4% to 4%. Scale bars (grayscale images) are 1 mm.
Fig. 5
Fig. 5
Average tracings of HbO2 (red lines) and Hb (blue lines) changes in controls (solid lines) and 3xTg-AD mice (dotted lines). Stimulation occurred from 2 to 4 s (shaded area) and standard error bars are shown. (a) Absolute hemoglobin changes calculated from the MBLL using SFDI-measured baseline optical properties. (b) Percentage hemoglobin changes calculated from the MBLL using SFDI-measured baseline optical properties. (c) Absolute hemoglobin changes calculated from the MBLL using literature-reported baseline optical properties. (d) Percentage hemoglobin changes calculated from the MBLL using literature-reported baseline optical properties.
Fig. 6
Fig. 6
Three parameters are compared that describe the overperfusion response in the mice. Graphs in (a), (b), and (c) are calculated in the case where the MBLL was informed with assumed DPFs, based on optical property values commonly used by other groups. Graphs in (d), (e), and (f) are calculated in the case where the MBLL was informed with SFDI-derived DPFs. (a, d) Peak hemodynamic change was determined by finding the largest concentration change from baseline of HbO2, Hb, and THb after the 2-s stimulation. (b, e) Area-under-the-curve (AUC) of the overperfusion after the 2-s stimulation was calculated by integrating the average hemoglobin concentration changes from 4 to 30 s. (c, f) Relaxation time T50 of the hemodynamic response was calculated as the time the overperfusion returns to half its peak value. *p<0.05 for both assumed DPF baseline and SFDI-derived DPF baseline for hemodynamic fitting. **p<0.05 for SFDI-derived DPF baseline and not assumed DPF baseline.

References

    1. Querfurth H. W., LaFerla F. M., “Alzheimer’s disease,” N. Engl. J. Med. 362(4), 329–344 (2010). 10.1056/NEJMra0909142 - DOI - PubMed
    1. Klunk W. E., et al. , “Imaging brain amyloid in Alzheimer’s disease with Pittsburgh compound-B,” Ann. Neurol. 55(3), 306–319 (2004). 10.1002/ana.20009 - DOI - PubMed
    1. Price J. L., et al. , “Neuropathology of nondemented aging: presumptive evidence for preclinical Alzheimer disease,” Neurobiol. Aging 30(7), 1026–1036 (2009). 10.1016/j.neurobiolaging.2009.04.002 - DOI - PMC - PubMed
    1. Vicenzini E., et al. , “Cerebrovascular reactivity in degenerative and vascular dementia: a transcranial Doppler study,” Eur. Neurol. 58(2), 84–89 (2007). 10.1159/000103642 - DOI - PubMed
    1. Silvestrini M., et al. , “Cerebrovascular reactivity and cognitive decline in patients with Alzheimer disease,” Stroke 37(4), 1010–1015 (2006). 10.1161/01.STR.0000206439.62025.97 - DOI - PubMed