

Pleiotropic Control by Testosterone of a Learned Vocal Behavior and Its Underlying Neuroplasticity(1,2,3)
- PMID: 26835510
- PMCID: PMC4724066
- DOI: 10.1523/ENEURO.0145-15.2016
Pleiotropic Control by Testosterone of a Learned Vocal Behavior and Its Underlying Neuroplasticity(1,2,3)
Abstract
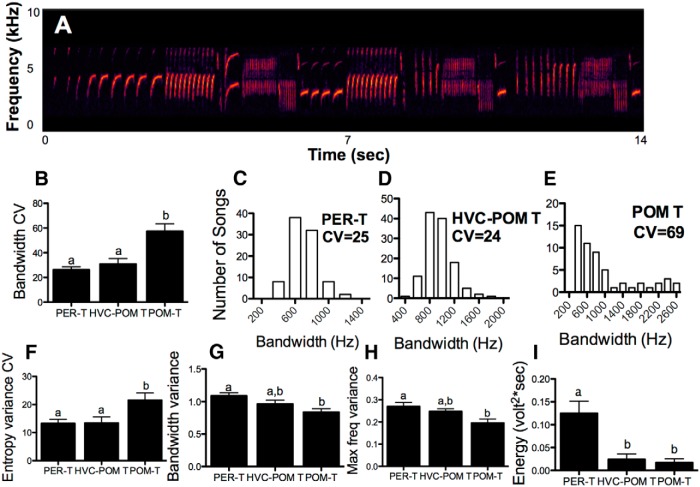
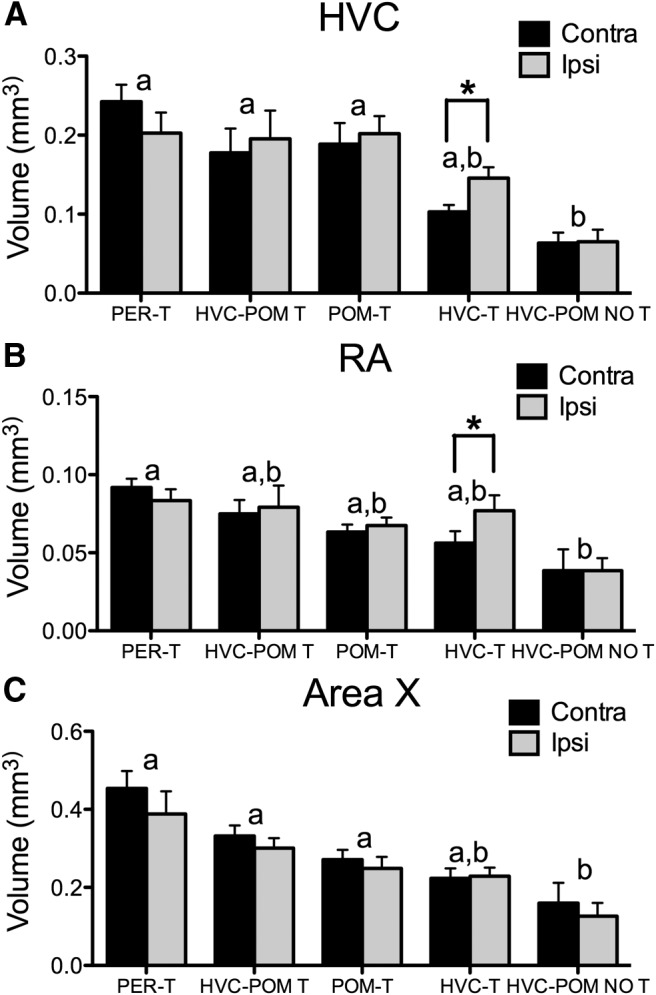
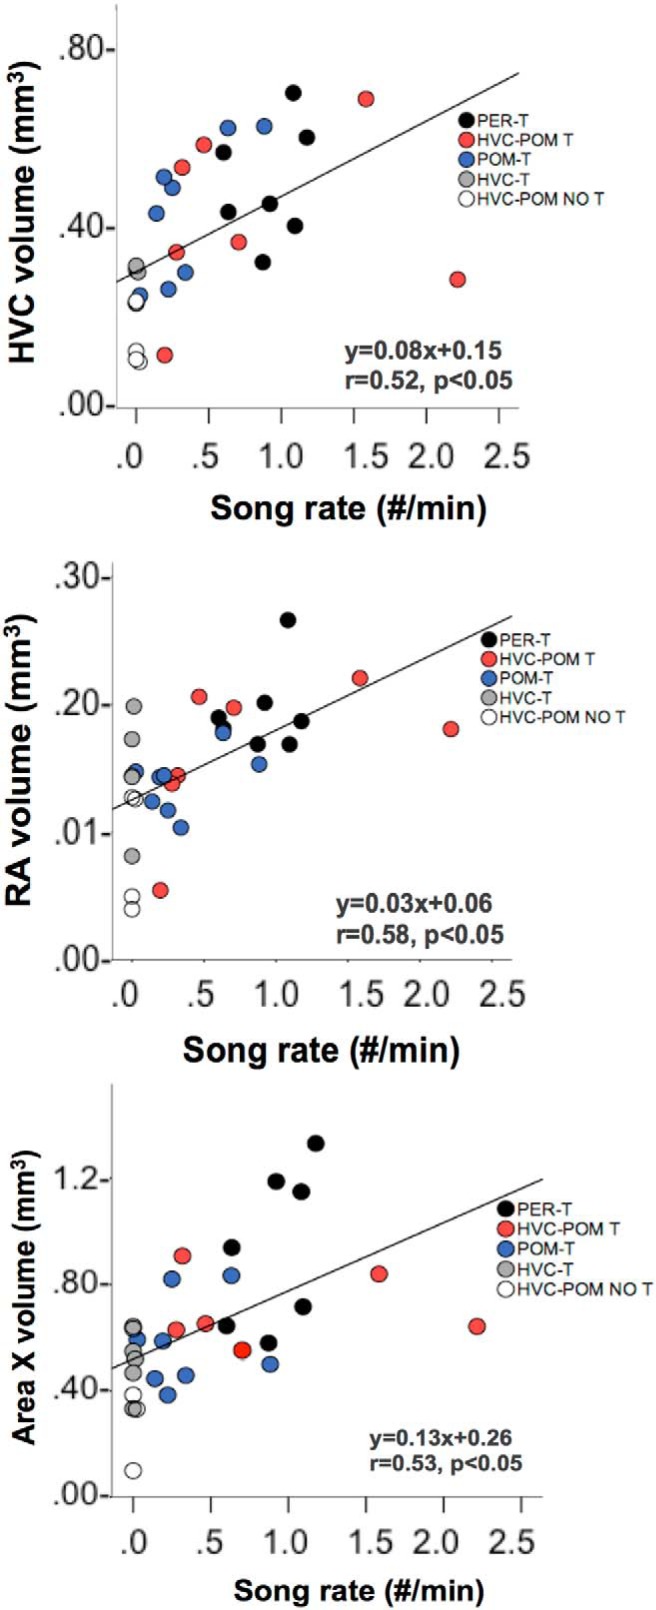
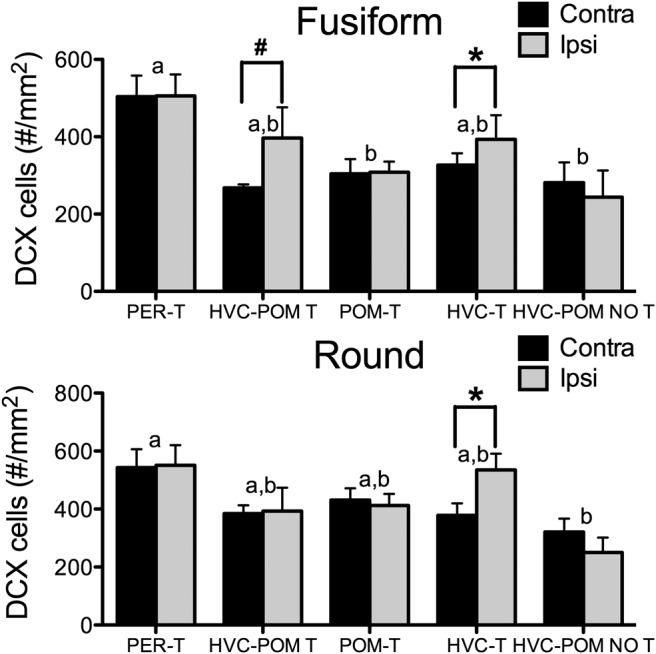
Steroid hormones coordinate multiple aspects of behavior and physiology. The same hormone often regulates different aspects of a single behavior and its underlying neuroplasticity. This pleiotropic regulation of behavior and physiology is not well understood. Here, we investigated the orchestration by testosterone (T) of birdsong and its neural substrate, the song control system. Male canaries were castrated and received stereotaxic implants filled with T in select brain areas. Implanting T solely in the medial preoptic nucleus (POM) increased the motivation to sing, but did not enhance aspects of song quality such as acoustic structure and stereotypy. In birds implanted with T solely in HVC (proper name), a key sensorimotor region of the song control system, little or no song was observed, similar to castrates that received no T implants of any sort. However, implanting T in HVC and POM simultaneously rescued all measures of song quality. Song amplitude, though, was still lower than what was observed in birds receiving peripheral T treatment. T in POM enhanced HVC volume bilaterally, likely due to activity-dependent changes resulting from an enhanced song rate. T directly in HVC, without increasing song rate, enhanced HVC volume on the ipsilateral side only. T in HVC enhanced the incorporation and recruitment of new neurons into this nucleus, while singing activity can independently influence the incorporation of new neurons into HVC. These results have broad implications for how steroid hormones integrate across different brain regions to coordinate complex social behaviors.
Keywords: medial preoptic area; neurogenesis; singing behavior; social behavior; songbirds.
Figures
Similar articles
-
Differential effects of global versus local testosterone on singing behavior and its underlying neural substrate.Proc Natl Acad Sci U S A. 2013 Nov 26;110(48):19573-8. doi: 10.1073/pnas.1311371110. Epub 2013 Nov 11. Proc Natl Acad Sci U S A. 2013. PMID: 24218603 Free PMC article.
-
Testosterone or Estradiol When Implanted in the Medial Preoptic Nucleus Trigger Short Low-Amplitude Songs in Female Canaries.eNeuro. 2019 May 8;6(2):ENEURO.0502-18.2019. doi: 10.1523/ENEURO.0502-18.2019. Print 2019 Mar/Apr. eNeuro. 2019. PMID: 31068363 Free PMC article.
-
Testosterone-induced neuroendocrine changes in the medial preoptic area precede song activation and plasticity in song control nuclei of female canaries.Eur J Neurosci. 2017 Apr;45(7):886-900. doi: 10.1111/ejn.13530. Epub 2017 Feb 20. Eur J Neurosci. 2017. PMID: 28135770
-
How does testosterone act to regulate a multifaceted adaptive response? Lessons from studies of the avian song system.J Neuroendocrinol. 2020 Jan;32(1):e12793. doi: 10.1111/jne.12793. Epub 2019 Oct 2. J Neuroendocrinol. 2020. PMID: 31514252 Review.
-
Birth, migration, incorporation, and death of vocal control neurons in adult songbirds.J Neurobiol. 1997 Nov;33(5):585-601. J Neurobiol. 1997. PMID: 9369461 Review.
Cited by
-
Song system neuroanatomy, and immediate early gene expression in a finch species with extensive male and female song.J Comp Physiol A Neuroethol Sens Neural Behav Physiol. 2024 Sep;210(5):735-749. doi: 10.1007/s00359-023-01651-9. Epub 2023 Jul 12. J Comp Physiol A Neuroethol Sens Neural Behav Physiol. 2024. PMID: 37436439
-
Androgen signaling in LMAN regulates song stereotypy in male canaries.Horm Behav. 2024 Sep;165:105611. doi: 10.1016/j.yhbeh.2024.105611. Epub 2024 Jul 31. Horm Behav. 2024. PMID: 39089160
-
Perinatal activation of ERα and ERβ but not GPER-1 masculinizes female rat caudate-putamen medium spiny neuron electrophysiological properties.J Neurophysiol. 2021 Jun 1;125(6):2322-2338. doi: 10.1152/jn.00063.2021. Epub 2021 May 12. J Neurophysiol. 2021. PMID: 33978486 Free PMC article.
-
Aromatase inhibition rapidly affects in a reversible manner distinct features of birdsong.Sci Rep. 2016 Aug 30;6:32344. doi: 10.1038/srep32344. Sci Rep. 2016. PMID: 27573712 Free PMC article.
-
New concepts in the study of the sexual differentiation and activation of reproductive behavior, a personal view.Front Neuroendocrinol. 2019 Oct;55:100785. doi: 10.1016/j.yfrne.2019.100785. Epub 2019 Aug 17. Front Neuroendocrinol. 2019. PMID: 31430485 Free PMC article. Review.
References
Publication types
MeSH terms
Substances
Grants and funding
LinkOut - more resources
Full Text Sources
Other Literature Sources