

Soluble Human Epidermal Growth Factor Receptor 2 (sHER2) as a Potential Risk Assessment, Screening, and Diagnostic Biomarker of Lung Adenocarcinoma
- PMID: 26835666
- PMCID: PMC4665577
- DOI: 10.3390/diagnostics3010013
Soluble Human Epidermal Growth Factor Receptor 2 (sHER2) as a Potential Risk Assessment, Screening, and Diagnostic Biomarker of Lung Adenocarcinoma
Abstract
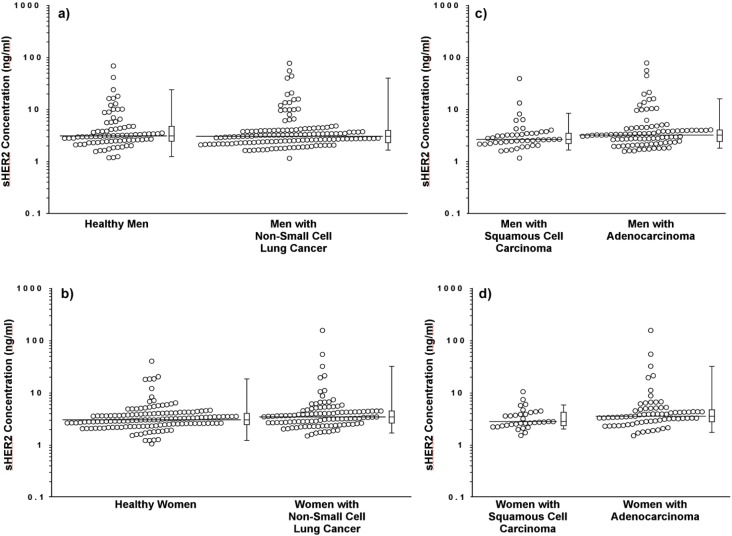
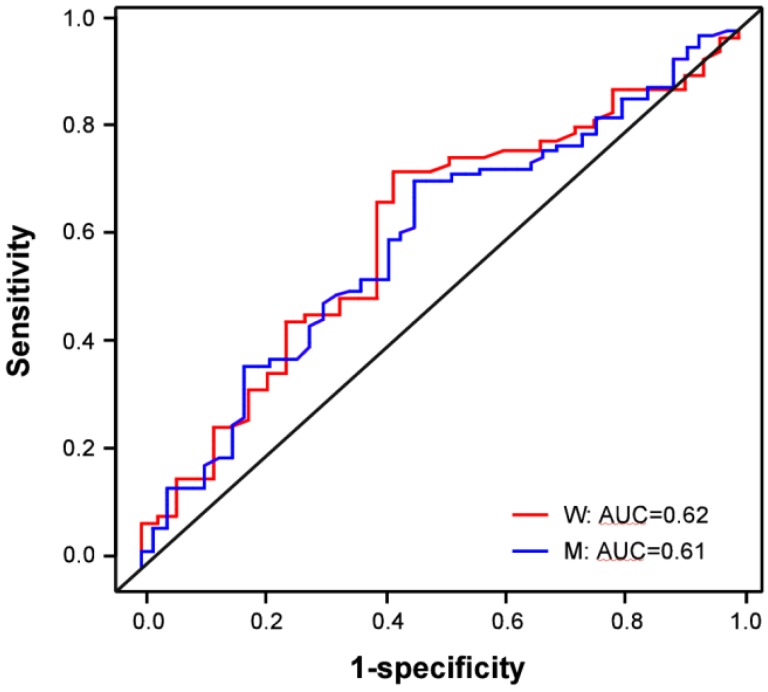
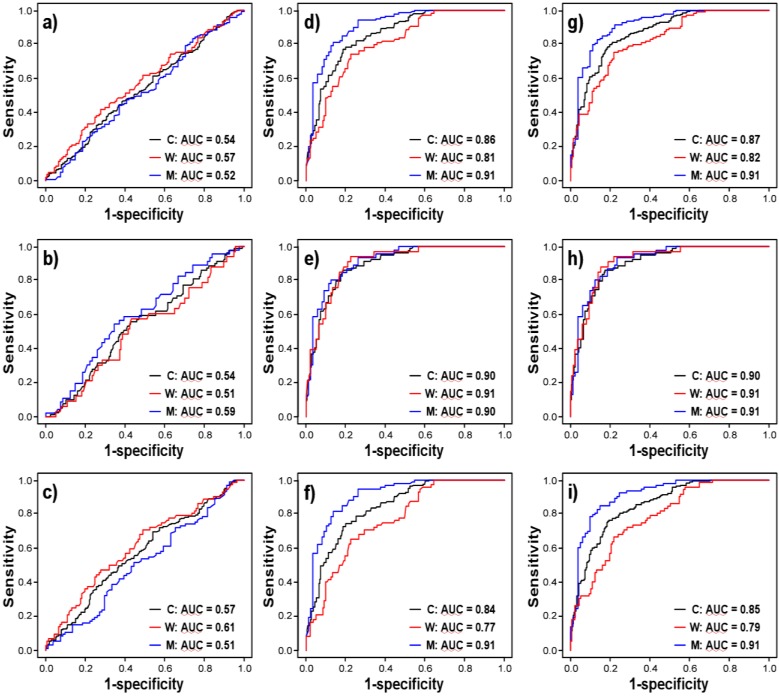
Lung cancer is the leading cause of cancer-related death in the United States. Here, we evaluated the potential clinical utility of soluble human epidermal growth factor receptor 2 (sHER2) for the risk assessment, screening, and diagnosis of non-small cell lung cancer (NSCLC) using an unmatched case-control study design. Serum sHER2 concentrations were measured by immunoassay in 244 primary NSCLC cases and 218 healthy controls. Wilcoxon rank-sum tests, logistic regression models, and receiver operating characteristic plots were used to assess whether sHER2 is associated with lung cancer. Median serum sHER2 concentrations are higher in patients with adenocarcinoma than squamous cell carcinoma regardless of gender, and sHER2 is a weak, independent biomarker of adenocarcinoma, but not of squamous cell carcinoma, adjusted for age and gender. The age-adjusted relative risk (odds) of adenocarcinoma is 3.95 (95% CI: 1.22, 12.81) and 7.93 (95% CI: 2.26, 27.82) greater for women and men with high sHER2 concentrations (≥6.60 ng/mL) vs. low sHER2 concentrations (≤1.85 ng/mL), respectively. When adjusted for each other, sHER2, age, and gender discern healthy controls from patients with primary adenocarcinomas of the lung with 85.9% accuracy. We conclude that even though serum sHER2 is not a strong, stand-alone discriminatory biomarker of adenocarcinoma, sHER2 may be a useful, independent covariate in multivariate risk assessment, screening, and diagnostic models of lung cancer.
Keywords: adenocarcinoma; diagnosis; early detection; non-small cell lung cancer; risk assessment; screening; soluble human epidermal growth factor receptor 2 (sHER2); squamous cell carcinoma (SCC).
Figures
Similar articles
-
Serum Human Epidermal Growth Factor 2 Extracellular Domain as a Predictive Biomarker for Lapatinib Treatment Efficacy in Patients With Advanced Breast Cancer.J Clin Oncol. 2016 Mar 20;34(9):936-44. doi: 10.1200/JCO.2015.62.4767. Epub 2016 Jan 25. J Clin Oncol. 2016. PMID: 26811533
-
Pilot Study on the Utility of Circulating HER2/Neu Levels in the Serum of Breast Cancer Patients.Anticancer Res. 2019 Oct;39(10):5345-5352. doi: 10.21873/anticanres.13727. Anticancer Res. 2019. PMID: 31570428
-
Clinical Relevance of Serum HER2 and Circulating Tumor Cell Detection in Metastatic Breast Cancer Patients.Anticancer Res. 2017 Jun;37(6):3117-3128. doi: 10.21873/anticanres.11669. Anticancer Res. 2017. PMID: 28551653
-
Prognostic value of baseline serum HER2 extracellular domain level with a cut-off value of 15 ng/mL in patients with breast cancer: a systematic review and meta-analysis.Breast Cancer Res Treat. 2018 Dec;172(3):513-521. doi: 10.1007/s10549-018-4942-4. Epub 2018 Aug 29. Breast Cancer Res Treat. 2018. PMID: 30159787
-
HER2 shedding and serum HER2 extracellular domain: biology and clinical utility in breast cancer.Cancer Treat Rev. 2012 Apr;38(2):133-42. doi: 10.1016/j.ctrv.2011.03.008. Epub 2011 May 5. Cancer Treat Rev. 2012. PMID: 21549508 Review.
Cited by
-
Women with COPD from biomass smoke have reduced serum levels of biomarkers of angiogenesis and cancer, with EGFR predominating, compared to women with COPD from smoking.Chron Respir Dis. 2021 Jan-Dec;18:14799731211005023. doi: 10.1177/14799731211005023. Chron Respir Dis. 2021. PMID: 33787367 Free PMC article.
References
-
- Altekruse S.F., Kosary C.L., Krapcho M., Neyman N., Aminou R., Waldron W., Ruhl J., Howlader N., Tatalovich Z., Cho H., et al. SEER Cancer Statistics Review, 1975–2007. [(accessed on 17 November 2012)]. Available online: http://seer.cancer.gov/csr/1975_2007.
Grants and funding
LinkOut - more resources
Full Text Sources
Other Literature Sources
Research Materials
