. 2013 Apr 2;3(2):244-60.
doi: 10.3390/diagnostics3020244.

A Rapid, Multiplexed, High-Throughput Flow-Through Membrane Immunoassay: A Convenient Alternative to ELISA

Affiliations

A Rapid, Multiplexed, High-Throughput Flow-Through Membrane Immunoassay: A Convenient Alternative to ELISA

Sujatha Ramachandran et al. Diagnostics (Basel). .

Abstract

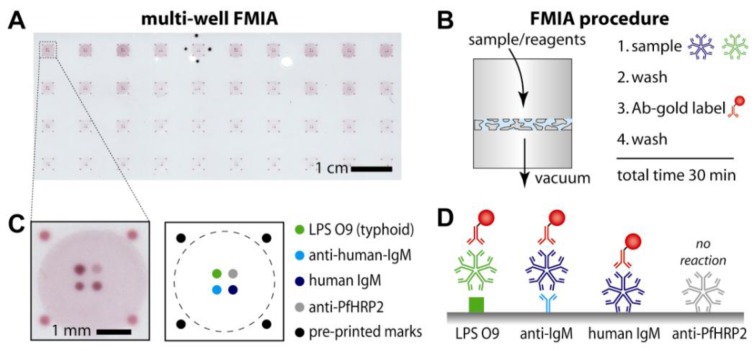
This paper describes a rapid, high-throughput flow-through membrane immunoassay (FMIA) platform. A nitrocellulose membrane was spotted in an array format with multiple capture and control reagents for each sample detection area, and assay steps were carried out by sequential aspiration of sample and reagents through each detection area using a 96-well vacuum manifold. The FMIA provides an alternate assay format with several advantages over ELISA. The high surface area of the membrane permits high label concentration using gold labels, and the small pores and vacuum control provide rapid diffusion to reduce total assay time to ~30 min. All reagents used in the FMIA are compatible with dry storage without refrigeration. The results appear as colored spots on the membrane that can be quantified using a flatbed scanner. We demonstrate the platform for detection of IgM specific to lipopolysaccharides (LPS) derived from Salmonella Typhi. The FMIA format provides analytical results comparable to ELISA in less time, provides integrated assay controls, and allows compensation for specimen-to-specimen variability in background, which is a particular challenge for IgM assays.

Keywords: Salmonella enterica serovar Typhi; enzyme-linked immunosorbent assay (ELISA); flow-through membrane immunoassay (FMIA); indirect IgM assay; low resource setting; multiplex; serodiagnosis; typhoid.


Figures

Figure 1
Figure 1
Flow-through membrane immunoassay (FMIA) format. (A) Image of the multi-well assay membrane (96 well format, 10 × 4 wells shown). (B) Sequence of FMIA steps. An array of sample detection regions was defined by a BioDot 96-well microfiltration apparatus; the flow-through region for each sample (a “well”) was defined by an open-bottom well above the membrane and a corresponding hole in a rubber gasket below the membrane (see Materials and Methods). (C) Schematic of the capture spots and control spots on the nitrocellulose membrane for a single well. Protein-coated gold (40 nm) was spotted on the outer edges as markers for alignment of the capture membrane on the vacuum manifold. The four innermost spots are assay and control spots (spot spacing is 500 µm center to center). (D) Schematic of the indirect anti-LPS IgM assay and control assays.
Figure 2
Figure 2
Example images from the FMIA format for indirect anti-LPS IgM detection with integrated control assays. Designations of strong, weak, and negative are based on the ELISA results. The anti-LPS IgM capture spots are indicated by arrows. (A) Example of a strong sample at different sample dilutions. The typhoid-specific IgM spot (upper left in each well) and endogenous IgM control spot (lower left in each well) respond to sample dilution, but the process control signal (lower right in each well) remains constant. (B) Examples of strong, weak, and negative samples with low background tested at a single dilution (1:100). The typhoid-specific IgM spot intensities mirror the results from ELISA, while control spots (lower in each well) are consistent between samples. (C) Examples of strong, weak, and negative samples that showed high background in non-spotted regions.
Figure 3
Figure 3
Quantitative comparison of ELISA and the FMIA format for a panel of 24 paired patient samples collected on the first visit from patients presenting with fever (Day 1) and one week later (Day 8). (A) The bars formula image 
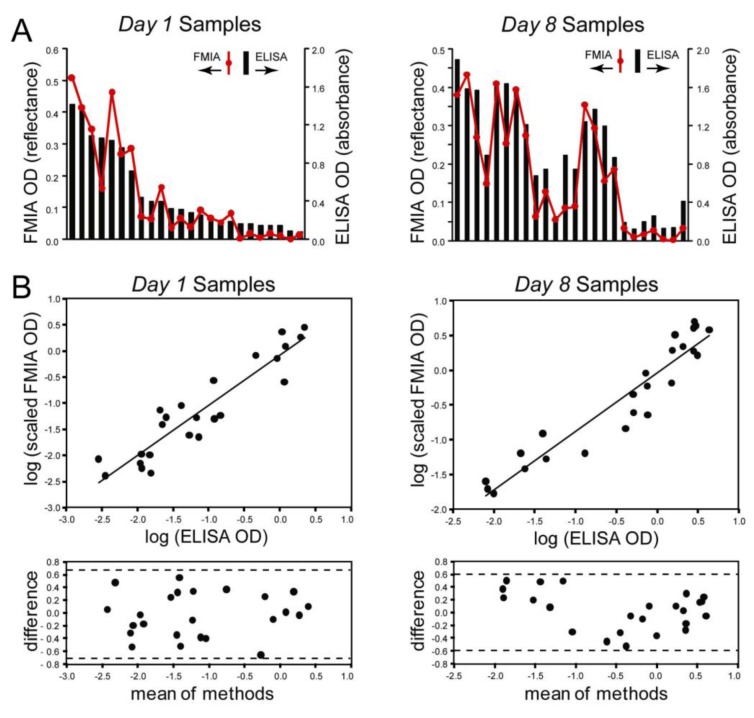
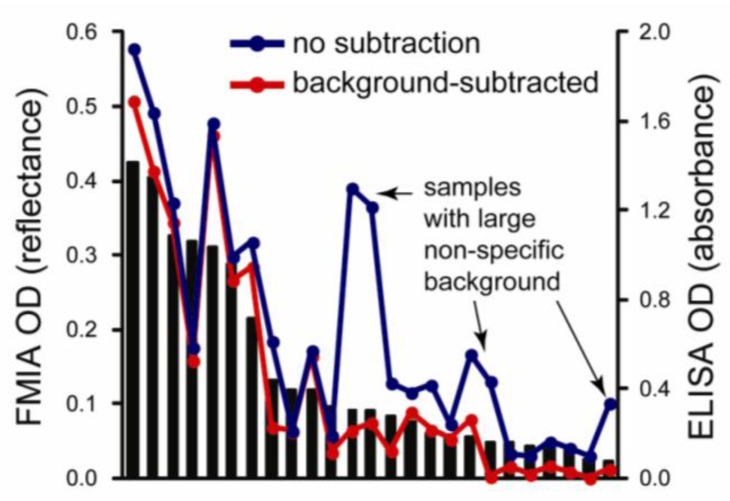
represent optical density (OD) from ELISA (absorbance measurements), and the line plots formula image 
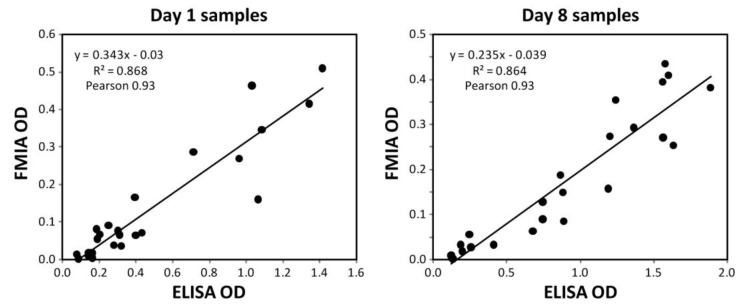
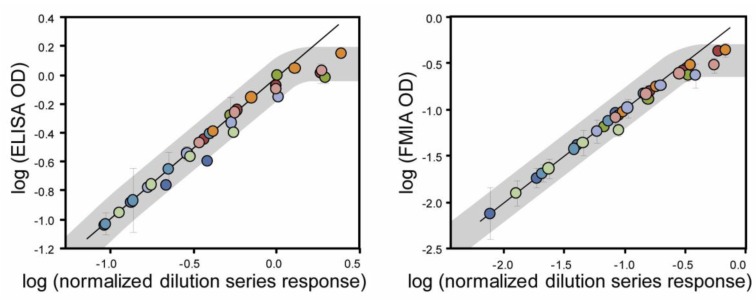
represent the background subtracted OD from the FMIA (reflectance measurements). (B) Log-log correlation plot of scaled FMIA OD versus ELISA OD for all samples reported in Panel A. The lower plots in Panel B show analysis of error distribution across the measured range (Bland-Altman analysis on scaled FMIA data). The error is well distributed and falls within the limits of agreement (dashed lines; 1.96 times standard deviation of errors).
Figure S1
Figure S1
(A) Sample dilution series for samples tested by FMIA and ELISA. The subset of samples shown was chosen from samples spanning strong to weak signals in ELISA. The FMIA and ELISA show similar responses across the dilution series. (B) Endogenous controls and process controls for the same samples as measured in the FMIA across the full dilution series. The endogenous control (detection of total IgM antibody in the sample) decreased in intensity with dilution as expected, while the process control (capture of the Ab-gold detection reagent by spotted human IgM) was constant across all dilutions, as expected.
Figure S2
Figure S2
Impact of background subtraction in the FMIA. The FMIA signals presented in Figure 3 included subtraction of background signal from unspotted (but blocked) regions of the membrane for each sample. The plot below reproduces the data from Figure 3 for FMIA (red) and ELISA (black bars) with additional overlay of FMIA signals without background subtraction (blue). If background subtraction was not performed, several samples deviated from ELISA due to large non-specific binding. Background subtraction in the FMIA accounted well for effects of non-specific binding.
Figure S3
Figure S3
Correlation plots for raw FMIA OD and raw ELISA OD data for Day 1 and Day 8 samples. Pearson correlation coefficients were 0.93 for Day 1 and Day 8 data sets. The increasing scatter at higher assay signals is expected for many assays; the error analysis in Figure 3 confirms that error scales with signal (i.e., constant CV; this is treated by applying the log-transformation in Figure 3). The best-fit correlation lines shown here were used to perform the linear scaling applied in Figure 3. Day 1 scaling resulting in Figure 3 data: scaled FMIA = (FMIA OD − 0.030) × 0.343; coefficient of determination 0.868. Day 8 scaling resulting in Figure 3 data: scaled FMIA = (FMIA OD − 0.039) × 0.235; coefficient of determination 0.864. Figure 3 in the text shows the linearly-scaled, log-transformed data; the plots below show the raw data.
Figure S4
Figure S4
Comparison of sample dilution series measured by ELISA and FMIA. Samples were serially-diluted (1:100, 1:200, 1:400, and 1:800) and tested by ELISA and FMIA; each set of colored data points represents the dilution series for a given sample tested by both methods. There is no purified source of the target analyte (LPS-specific human IgM antibody), so creating a quantitative response curve by conventional sample spiking was not possible. Because the analyte concentrations for these patient samples are not known, the response curves for each sample dilution series were normalized to fall on a single response curve to estimate the linear response range from patient samples. Specifically, the linear portion of the dilution series for each patient sample (data points of a given color) was fit to a line, and the data points for that sample were scaled by the slope of the response curve to collapse the data on a common response curve. The normalization has no effect on the shape of individual response curves. Thus, the concentration scale is arbitrary, but it gives a qualitative indication of the linear range for the two formats. Each color represents the dilution series for an individual sample, and error bars are for two replicates performed on each sample at each dilution. Saturation at high signals is qualitatively indicated by the gray trace. The apparent linear range is similar for ELISA and FMIA.

References

    1. Yager P., Edwards T., Fu E., Helton K., Nelson K., Tam M.R., Weigl B.H. Microfluidic diagnostic technologies for global public health. Nature. 2006;442:412–418. - PubMed
    1. Yager P., Domingo G.J., Gerdes J. Point-of-care diagnostics for global health. Annu. Rev. Biomed. Eng. 2008;10:107–144. doi: 10.1146/annurev.bioeng.10.061807.160524. - DOI - PubMed
    1. Spicar-Mihalic P., Stevens D.Y., Yager P. Progress toward a Flow-Through Membrane ELISA in a Microfluidic Format; Proceedings of the 11th International Conference on Miniaturized Systems for Chemistry and Life Sciences (MicroTAS 2007); Paris, France. 7–11 October 2007; pp. 667–669.
    1. Stevens D.Y., Petri C.R., Osborn J.L., Spicar-Mihalic P., McKenzie K.G., Yager P. Enabling a microfluidic immunoassay for the developing world by integration of on-card dry reagent storage. Lab Chip. 2008;8:2038–2045. doi: 10.1039/b811158h. - DOI - PubMed
    1. Stevens D.Y., Petri C.R., Osborn J.L., Spicar-Mihalic P., McKenzie K.G., Yager P. Rapid and Quantitative Detection of Malarial Antigen for Microfluidic Point-of-Care Diagnosis in the Developing World; Proceedings of the 20th International Conference on Miniaturized Systems for Chemistry and Life Sciences (MicroTAS 2008); San Diego, CA, USA. 12–16 October 2008; pp. 1768–1770.