. 2016 Feb 23;10(2):2702-15.
doi: 10.1021/acsnano.5b07781. Epub 2016 Feb 9.

Irinotecan Delivery by Lipid-Coated Mesoporous Silica Nanoparticles Shows Improved Efficacy and Safety over Liposomes for Pancreatic Cancer

Affiliations

Irinotecan Delivery by Lipid-Coated Mesoporous Silica Nanoparticles Shows Improved Efficacy and Safety over Liposomes for Pancreatic Cancer

Xiangsheng Liu et al. ACS Nano. .

Abstract

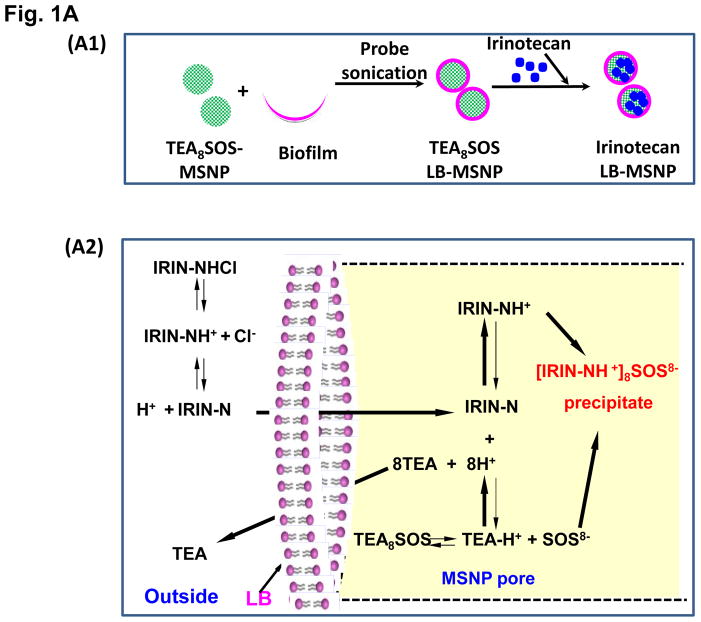
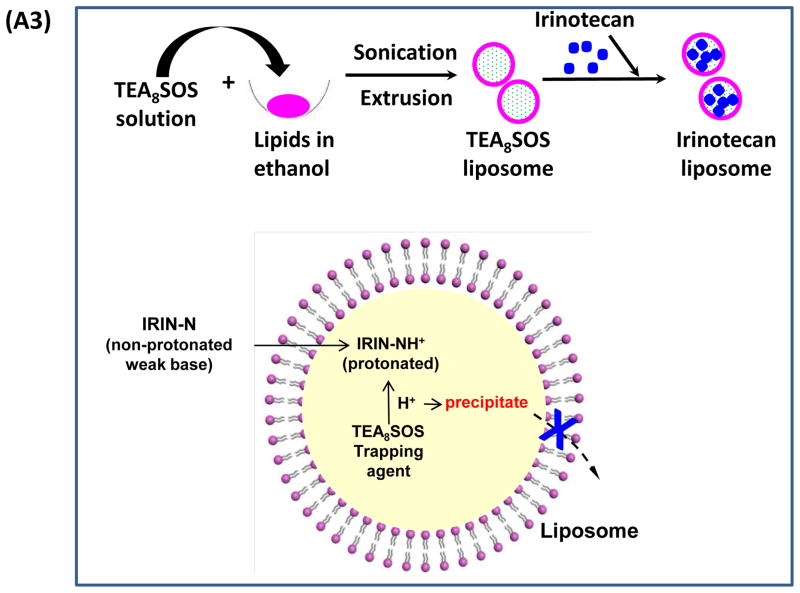
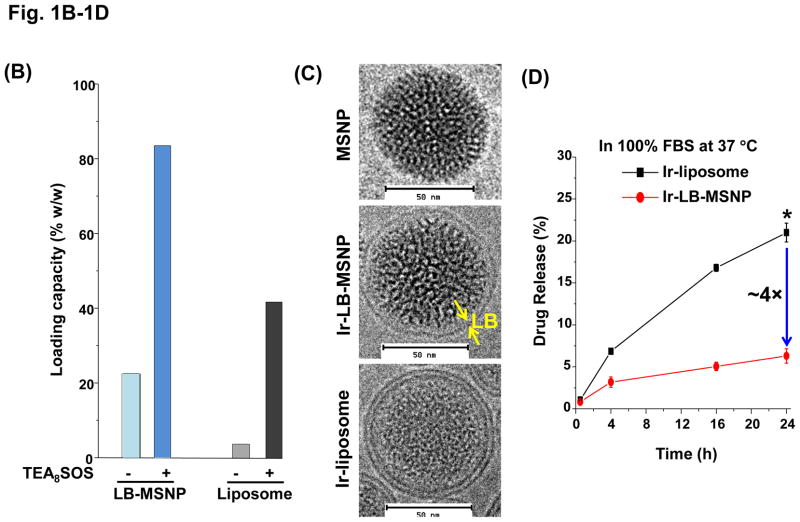
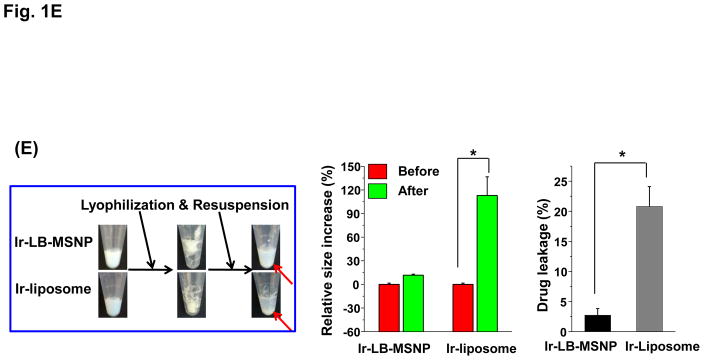
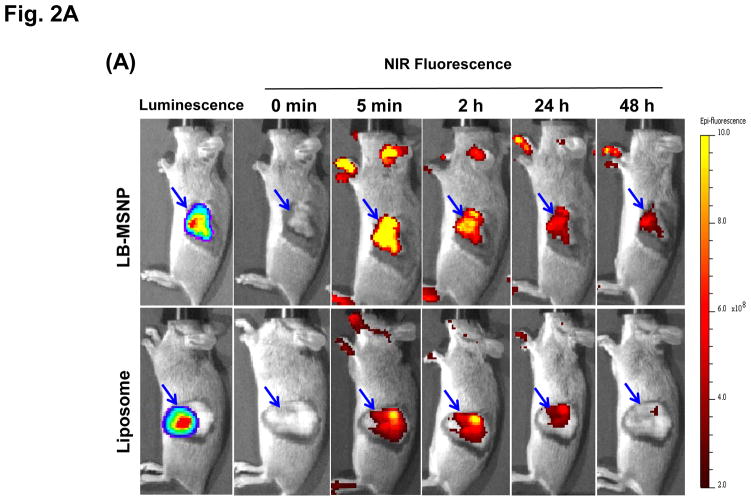
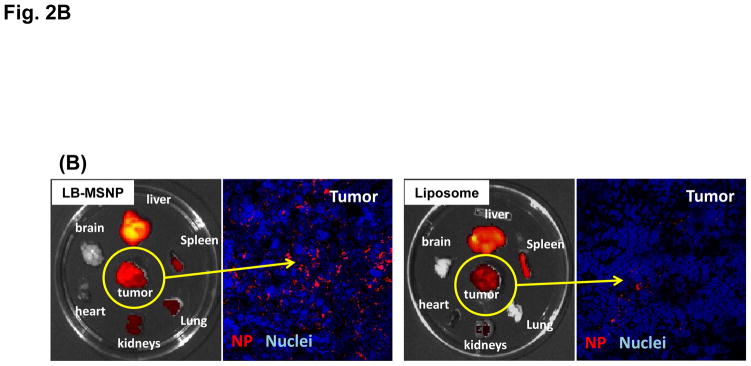
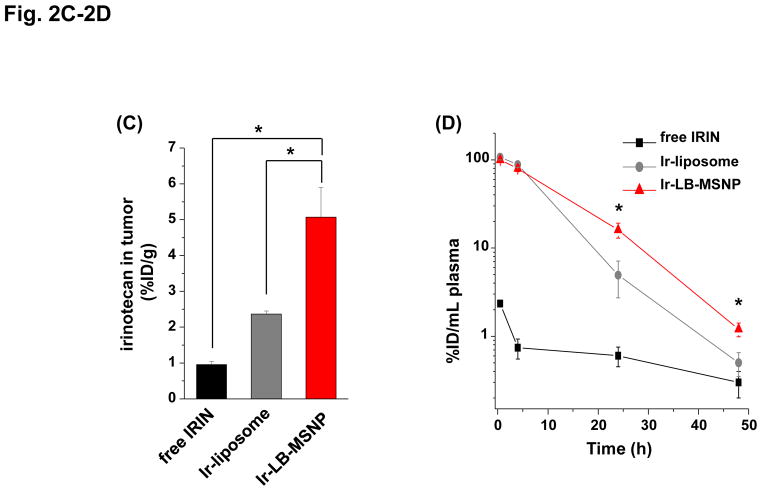
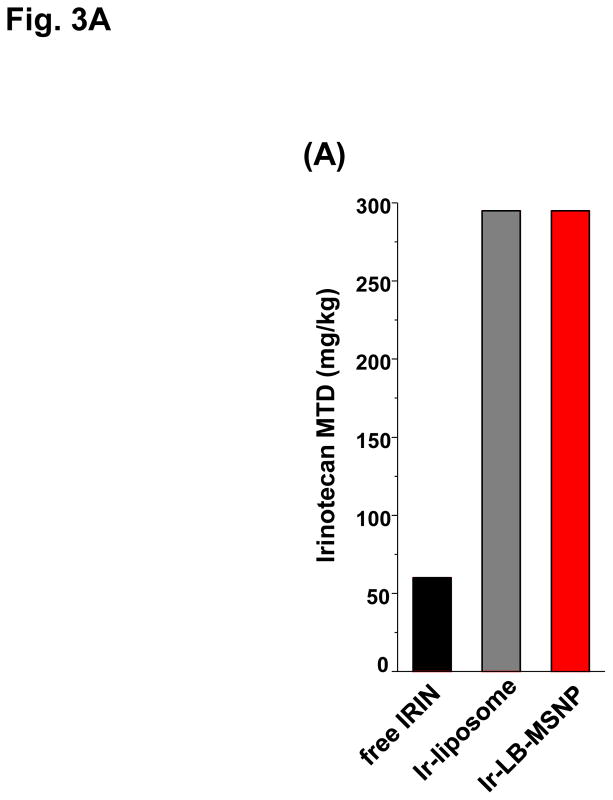
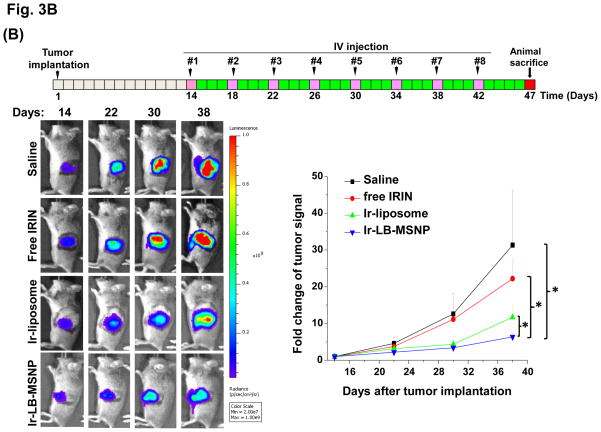
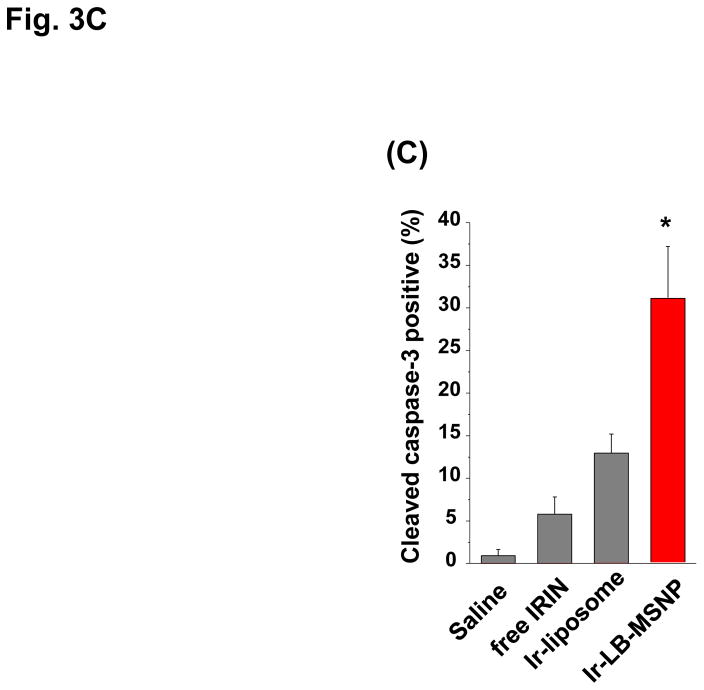
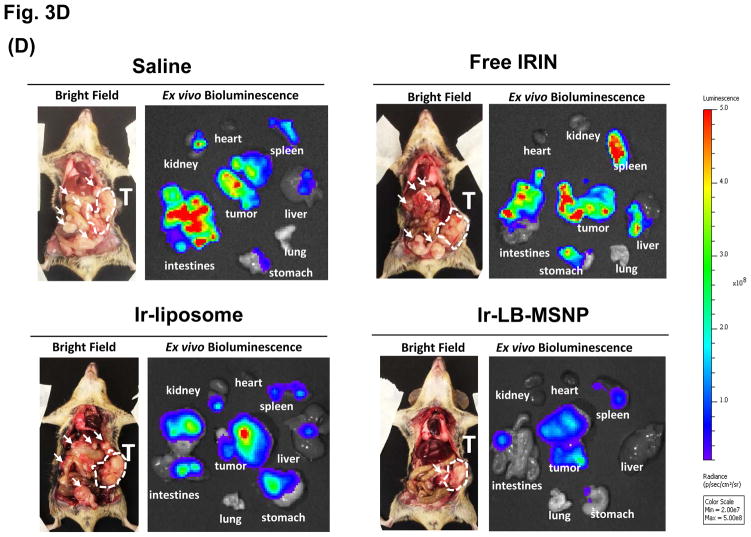
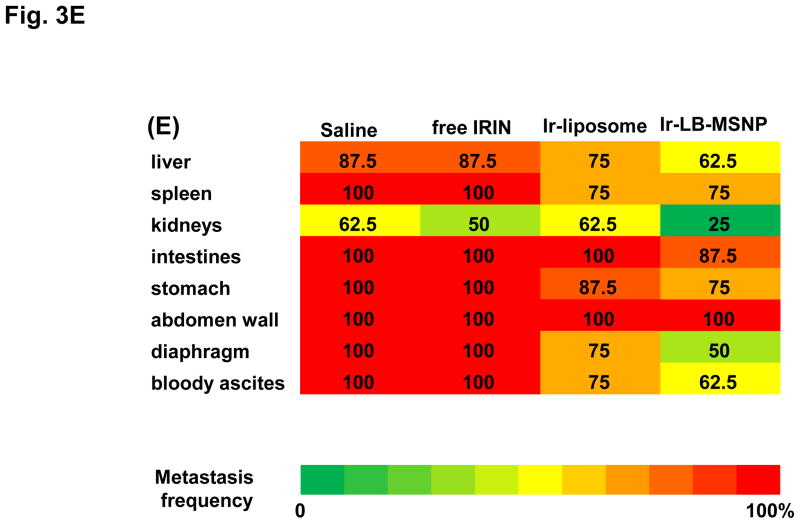
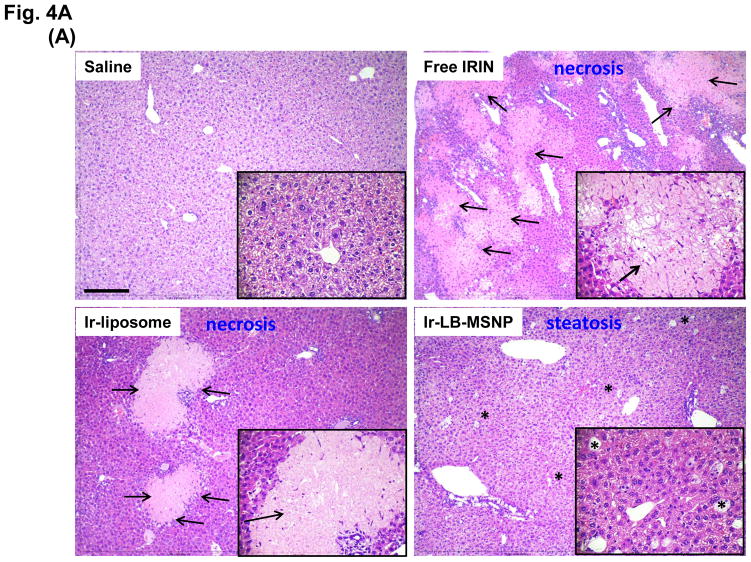
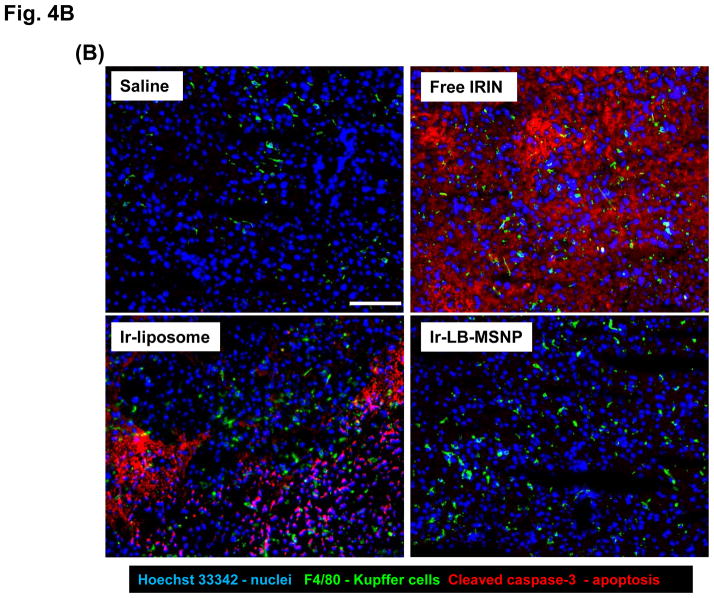
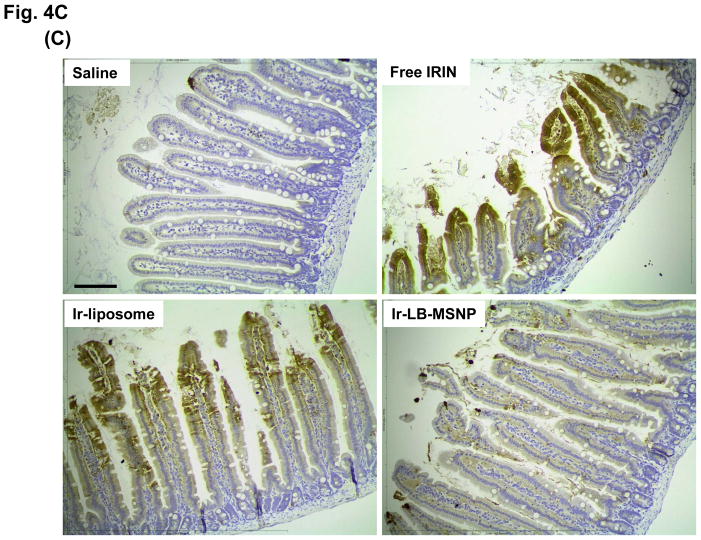
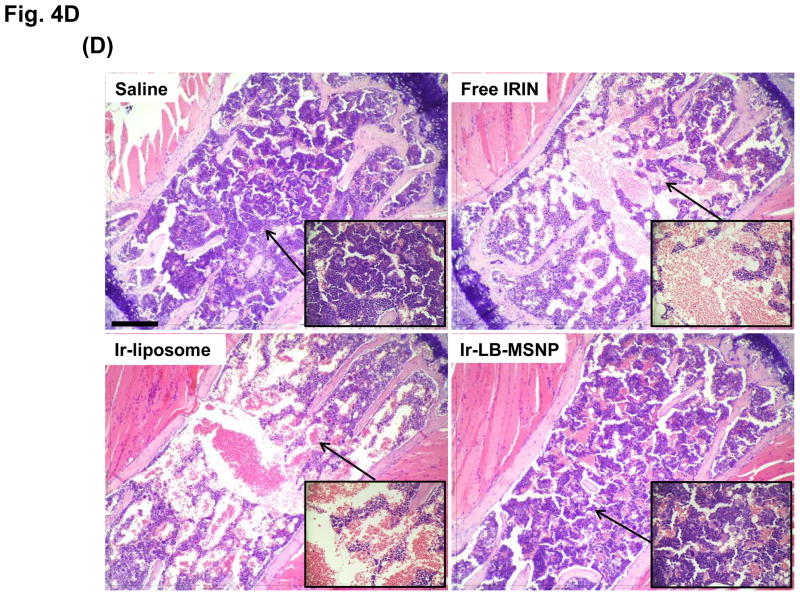
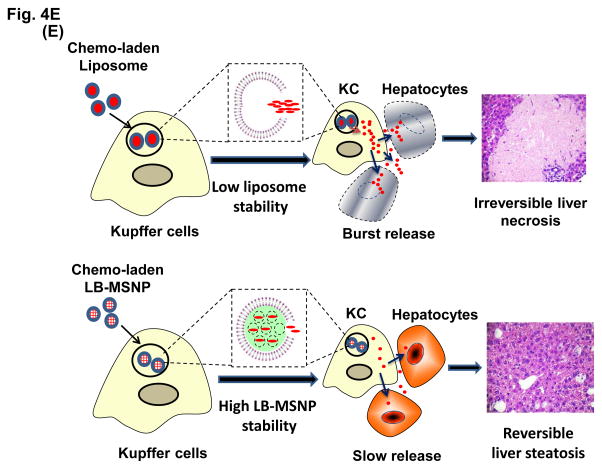
Urgent intervention is required to improve the 5 year survival rate of pancreatic ductal adenocarcinoma (PDAC). While the four-drug regimen, FOLFIRINOX (comprising irinotecan, 5-fluorouracil, oxaliplatin, and leucovorin), has a better survival outcome than the more frequently used gemcitabine, the former treatment platform is highly toxic and restricted for use in patients with good performance status. Since irinotecan contributes significantly to FOLFIRINOX toxicity (bone marrow and gastrointestinal tract), our aim was to reduce the toxicity of this drug by a custom-designed mesoporous silica nanoparticle (MSNP) platform, which uses a proton gradient for high-dose irinotecan loading across a coated lipid bilayer (LB). The improved stability of the LB-coated MSNP (LB-MSNP) carrier allowed less drug leakage systemically with increased drug concentrations at the tumor sites of an orthotopic Kras-derived PDAC model compared to liposomes. The LB-MSNP nanocarrier was also more efficient for treating tumor metastases. Equally important, the reduced leakage and slower rate of drug release by the LB-MSNP carrier dramatically reduced the rate of bone marrow, gastrointestinal, and liver toxicity compared to the liposomal carrier. We propose that the combination of high efficacy and reduced toxicity by the LB-MSNP carrier could facilitate the use of irinotecan as a first-line therapeutic to improve PDAC survival.

Keywords: FOLFIRINOX; irinotecan; lipid bilayer; mesoporous silica nanoparticle; pancreatic cancer; proton gradient; toxicity reduction.


Conflict of interest statement

The authors declare no competing financial interest.

Figures

Figure 1
Figure 1. Establishing LB-MSNP and liposomal irinotecan carriers that use a protonating agent for drug loading
(A) Schematics depicting the synthesis method and loading of irinotecan by LB-MSNPs and liposomes. (A1) After soaking TEA8SOS into the MSNP particles, the pores are sealed by a LB, derived from sonication of a lipid biofilm.(A2) TEA8SOS-soaked particles are incubated in an irinotecan solution, allowing the amphipathic drug to diffuse across the lipid bilayer for protonation by TEA8SOS (TEA8SOS↔ 8TEA + 8H+ + SOS8−). The lipid-soluble TEA exits the particle, while the H+ converts irinotecan to a hydrophilic derivative that cannot cross the LB. The protonated drug interacts with SOS8− to form gel-like precipitate, which is retained in the pores. (A3) Same technique was used to produce a liposomal equivalent for irinotecan entrapment. (B) Assessment of the drug loading capacity (DLC) of the Ir-LB-MSNP and Ir-liposome carriers. DLC= [the total amount of irinotecan (m0) – non-encapsulated irinotecan (m1)]/[the total amount of particle (mMSNP or mlipid)]×100%. The inclusion of TEA8SOS had a negligible effect on the hydrodynamic size and ζ-potential of the particles. Hydrodynamic size and ζ-potential data are shown in Table S1. (C) CryoEM images of the empty, noncoated MSNP, Ir-LB-MSNP and Ir-liposome carriers. The technique is sensitive enough to visualize irinotecan precipitation in the liposome. (D) Carrier stability was assessed by incubation in 100% serum at 37 °C for 24 h and drug leakage was determined by high-performance liquid chromatography. (E) Carrier stability, as determined by the change in hydrodynamic diameter and % drug leakage, following lyophilization and water resuspension.
Figure 2
Figure 2. Biodistribution of the Ir-LB-MSNPs and Ir-liposomes
(A) Interval IVIS imaging over 48 h to compare the biodistribution of IV injected NIR-labeled carriers to the KPC-derived orthotopic tumor site (n=3). NIR fluorescence images in representative animals after IV injection of 100 mg/kg NIR-labeled LB-MSNPs or liposomes are shown. (B) Ex vivo imaging of explanted organs in the same experiment; animals were sacrificed after 24 h. Confocal microscopy confirmed a higher abundance of NIR-labeled LB-MSNP compared to liposomes at the tumor site. (C) Irinotecan tumor content was determined in an orthotopic KPC-derived xenograft model (n=3). Animals received IV injection of an irinotecan dose equivalent to 60 mg/kg for the different drug formulations. Following animal sacrifice after 24 h, tumor tissues were collected for the measurement of irinotecan content by HPLC. Irinotecan content was expressed as % total injected dose per gram of tumor tissue (%ID/g). Data represent mean ± SD, *p<0.05. (D) HPLC measurement of plasma irinotecan concentration in the same experiment. Data represent mean ± SD, * p<0.05.
Figure 3
Figure 3. Differential tumor inhibitory effect of the free drug and encapsulated irinotecan carriers in the KPC-derived orthotopic tumor model
(A)Assessment of the MTD in an acute dose finding study, using a NCI protocol. (B) Growth inhibition of KPC-derived orthotopic tumors in B6/129 mice, following IV administration of 40 mg/kg free drug or encapsulated irinotecan every 4 days for up to 8 administrations. Interval IVIS imaging was used for monitoring tumor growth, which was quantitatively expressed according to the image intensity at the operator-defined ROI. (C) Quantitative analysis of apoptosis (using IHC staining for cleaved caspase-3)at the primary tumor site of the animals after treatment (sacrificed on days 40–47). (D) Representative autopsy results and ex vivo imaging of bioluminescence intensity in the moribund animals (sacrificed on days 40–47) to show treatment impact on surrounding metastases. Visible metastatic spread could be seen in the stomach, intestines, liver, spleen, kidneys, diaphragm, and abdominal wall. There was no infiltration of the heart or lung. (E) Heat map display to summarize the comparative analysis of tumor spread determined by quantitative ex vivo imaging in (D). Data represent mean ± SEM,* p<0.05.
Figure 4
Figure 4. Comparative analysis of toxicity reduction by Ir-LB-MSNPs vs. Ir-liposomes
(A) Liver histology obtained from representative moribund animals (sacrificed on days 40–47) using tissue from the experiment shown in Figure 3B. The arrows in the H&E stained sections point to necrotic liver tissue, while sites marked with an asterisk denote steatosis. Bar is 200 μm. (B) Dual IHC staining of cleaved caspase-3 (apoptosis marker, red) and F4/80 (KC marker, green) in the livers of animals receiving different irinotecan formulations at a dose equivalent of 60 mg/kg, followed by sacrifice at 24 h. The nucleus was stained with Hoechst 33342 (blue). Bar = 100 μm. (C) IHC staining for cleaved caspase-3, with H&E counterstaining to reveal the spread of apoptosis and blunting of the intestinal villi in the same treated animal groups studied in Figure 3B. The bar represents 100 μm. (D) Separate experiment, in which a 40 mg/kg dose-equivalent of irinotecan, IV injected every second day, three times, was used to study the impact on sternal bone marrow. The sternums were collected on day 7 for embedding, decalcification and H&E staining. The bar represents 200 μm. (E) Schematic to explain the differential hepatotoxicity of Ir-LB-MSNP and Ir-liposome formulations in the liver. We propose that the injected nanocarriers are initially taken up by KCs, where carrier disintegration leads to the irinotecan release to bystander hepatocytes. The subsequent rate of carrier disintegration and drug release to the hepatocytes could determine whether the extent to which the irinotecan is metabolized and rendered inactive. We further hypothesize that the higher instability of the liposomal carrier leads to more rapid drug release than the more stable Ir-LB-MSNP, which explains the differences in apoptosis and necrosis.

Similar articles

Cited by

References

    1. Siegel R, Ma J, Zou Z, Jemal A. Cancer Statistics, 2014. CA-Cancer J Clin. 2014;64:9–29. - PubMed
    1. Conroy T, Desseigne F, Ychou M, Bouché O, Guimbaud R, Bécouarn Y, Adenis A, Raoul JL, Gourgou-Bourgade S, de la Fouchardière C, Bennouna J, Bachet JB, Khemissa-Akouz F, Péré-Vergé D, Delbaldo C, Assenat E, Chauffert B, Michel P, Montoto-Grillot C, Ducreux M. FOLFIRINOX versus Gemcitabine for Metastatic Pancreatic Cancer. New Engl J Med. 2011;364:1817–1825. - PubMed
    1. Ueno H, Okusaka T, Funakoshi A, Ishii H, Yamao K, Ishikawa O, Ohkawa S, Saitoh S. A Phase II Study of Weekly Irinotecan as First-Line Therapy for Patients with Metastatic Pancreatic Cancer. Cancer Chemoth Pharm. 2007;59:447–454. - PubMed
    1. Loupakis F, Schirripa M, Caparello C, Funel N, Pollina L, Vasile E, Cremolini C, Salvatore L, Morvillo M, Antoniotti C. Histopathologic Evaluation of Liver Metastases from Colorectal Cancer in Patients Treated with FOLFOXIRI plus Bevacizumab. Brit J Cancer. 2013;108:2549–2556. - PMC - PubMed
    1. Chou TH, Chen SC, Chu IM. Effect of Composition on the Stability of Liposomal Irinotecan Prepared by a pH Gradient Method. J Biosci Bioeng. 2003;95:405–408. - PubMed

Publication types

MeSH terms